
Advertisement
Subdued Growth No Barrier To Gemilang International Limited (HKG:6163) With Shares Advancing 28%

Gemilang International Limited (HKG:6163) shares have had a really impressive month, gaining 28% after a shaky period beforehand. The bad news is that even after the stocks recovery in the last 30 days, shareholders are still underwater by about 5.7% over the last year.
Although its price has surged higher, it's still not a stretch to say that Gemilang International's price-to-sales (or "P/S") ratio of 0.6x right now seems quite "middle-of-the-road" compared to the Machinery industry in Hong Kong, seeing as it matches the P/S ratio of the wider industry. Although, it's not wise to simply ignore the P/S without explanation as investors may be disregarding a distinct opportunity or a costly mistake.
Check out our latest analysis for Gemilang International
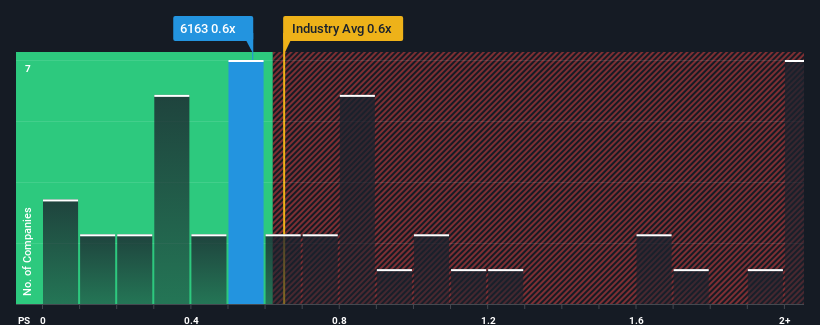
What Does Gemilang International's P/S Mean For Shareholders?
For example, consider that Gemilang International's financial performance has been poor lately as its revenue has been in decline. It might be that many expect the company to put the disappointing revenue performance behind them over the coming period, which has kept the P/S from falling. If you like the company, you'd at least be hoping this is the case so that you could potentially pick up some stock while it's not quite in favour.
We don't have analyst forecasts, but you can see how recent trends are setting up the company for the future by checking out our free report on Gemilang International's earnings, revenue and cash flow.How Is Gemilang International's Revenue Growth Trending?
In order to justify its P/S ratio, Gemilang International would need to produce growth that's similar to the industry.
Retrospectively, the last year delivered a frustrating 48% decrease to the company's top line. As a result, revenue from three years ago have also fallen 54% overall. Therefore, it's fair to say the revenue growth recently has been undesirable for the company.
In contrast to the company, the rest of the industry is expected to grow by 12% over the next year, which really puts the company's recent medium-term revenue decline into perspective.
With this information, we find it concerning that Gemilang International is trading at a fairly similar P/S compared to the industry. It seems most investors are ignoring the recent poor growth rate and are hoping for a turnaround in the company's business prospects. Only the boldest would assume these prices are sustainable as a continuation of recent revenue trends is likely to weigh on the share price eventually.
The Final Word
Gemilang International appears to be back in favour with a solid price jump bringing its P/S back in line with other companies in the industry While the price-to-sales ratio shouldn't be the defining factor in whether you buy a stock or not, it's quite a capable barometer of revenue expectations.
Our look at Gemilang International revealed its shrinking revenues over the medium-term haven't impacted the P/S as much as we anticipated, given the industry is set to grow. Even though it matches the industry, we're uncomfortable with the current P/S ratio, as this dismal revenue performance is unlikely to support a more positive sentiment for long. Unless the the circumstances surrounding the recent medium-term improve, it wouldn't be wrong to expect a a difficult period ahead for the company's shareholders.
There are also other vital risk factors to consider before investing and we've discovered 3 warning signs for Gemilang International that you should be aware of.
Of course, profitable companies with a history of great earnings growth are generally safer bets. So you may wish to see this free collection of other companies that have reasonable P/E ratios and have grown earnings strongly.
New: Manage All Your Stock Portfolios in One Place
We've created the ultimate portfolio companion for stock investors, and it's free.
• Connect an unlimited number of Portfolios and see your total in one currency
• Be alerted to new Warning Signs or Risks via email or mobile
• Track the Fair Value of your stocks
Have feedback on this article? Concerned about the content? Get in touch with us directly. Alternatively, email editorial-team (at) simplywallst.com.
This article by Simply Wall St is general in nature. We provide commentary based on historical data and analyst forecasts only using an unbiased methodology and our articles are not intended to be financial advice. It does not constitute a recommendation to buy or sell any stock, and does not take account of your objectives, or your financial situation. We aim to bring you long-term focused analysis driven by fundamental data. Note that our analysis may not factor in the latest price-sensitive company announcements or qualitative material. Simply Wall St has no position in any stocks mentioned.
About SEHK:6163
Gemilang International
An investment holding company, engages in the design, manufacture, and sale of bus bodies in Malaysia and Singapore.
Slight and slightly overvalued.
Market Insights

Advertisement
Community Narratives

Apple: A Dying Star with an Overpriced Valuation
Fair Value US$177.34|20.1% overvalued
IN
Community Contributor
Avino a case for USD$20 per share within 5 years (assuming $3,500 gold, $100 silver and $4 copper).
Fair Value CA$26.79|87.5% undervalued
AG
Community Contributor
Riding the Defense Boom RENK Sees Revenue Climb at 15% CAGR by FY 2029
Fair Value €69.87|20.5% undervalued
CH
Community Contributor