Estimating The Intrinsic Value Of Zhengzhou Coal Mining Machinery Group Company Limited (HKG:564)


Today we will run through one way of estimating the intrinsic value of Zhengzhou Coal Mining Machinery Group Company Limited (HKG:564) by taking the expected future cash flows and discounting them to their present value. One way to achieve this is by employing the Discounted Cash Flow (DCF) model. There's really not all that much to it, even though it might appear quite complex.
We would caution that there are many ways of valuing a company and, like the DCF, each technique has advantages and disadvantages in certain scenarios. If you still have some burning questions about this type of valuation, take a look at the Simply Wall St analysis model.
See our latest analysis for Zhengzhou Coal Mining Machinery Group
The calculation
We're using the 2-stage growth model, which simply means we take in account two stages of company's growth. In the initial period the company may have a higher growth rate and the second stage is usually assumed to have a stable growth rate. In the first stage we need to estimate the cash flows to the business over the next ten years. Seeing as no analyst estimates of free cash flow are available to us, we have extrapolate the previous free cash flow (FCF) from the company's last reported value. We assume companies with shrinking free cash flow will slow their rate of shrinkage, and that companies with growing free cash flow will see their growth rate slow, over this period. We do this to reflect that growth tends to slow more in the early years than it does in later years.
A DCF is all about the idea that a dollar in the future is less valuable than a dollar today, and so the sum of these future cash flows is then discounted to today's value:
10-year free cash flow (FCF) forecast
| 2022 | 2023 | 2024 | 2025 | 2026 | 2027 | 2028 | 2029 | 2030 | 2031 | |
| Levered FCF (CN¥, Millions) | CN¥1.04b | CN¥938.0m | CN¥878.0m | CN¥842.5m | CN¥822.4m | CN¥812.4m | CN¥809.0m | CN¥810.3m | CN¥814.8m | CN¥821.5m |
| Growth Rate Estimate Source | Est @ -14.61% | Est @ -9.78% | Est @ -6.4% | Est @ -4.04% | Est @ -2.38% | Est @ -1.22% | Est @ -0.41% | Est @ 0.16% | Est @ 0.55% | Est @ 0.83% |
| Present Value (CN¥, Millions) Discounted @ 7.9% | CN¥964 | CN¥806 | CN¥700 | CN¥623 | CN¥564 | CN¥516 | CN¥477 | CN¥443 | CN¥413 | CN¥386 |
("Est" = FCF growth rate estimated by Simply Wall St)
Present Value of 10-year Cash Flow (PVCF) = CN¥5.9b
We now need to calculate the Terminal Value, which accounts for all the future cash flows after this ten year period. For a number of reasons a very conservative growth rate is used that cannot exceed that of a country's GDP growth. In this case we have used the 5-year average of the 10-year government bond yield (1.5%) to estimate future growth. In the same way as with the 10-year 'growth' period, we discount future cash flows to today's value, using a cost of equity of 7.9%.
Terminal Value (TV)= FCF2031 × (1 + g) ÷ (r – g) = CN¥822m× (1 + 1.5%) ÷ (7.9%– 1.5%) = CN¥13b
Present Value of Terminal Value (PVTV)= TV / (1 + r)10= CN¥13b÷ ( 1 + 7.9%)10= CN¥6.1b
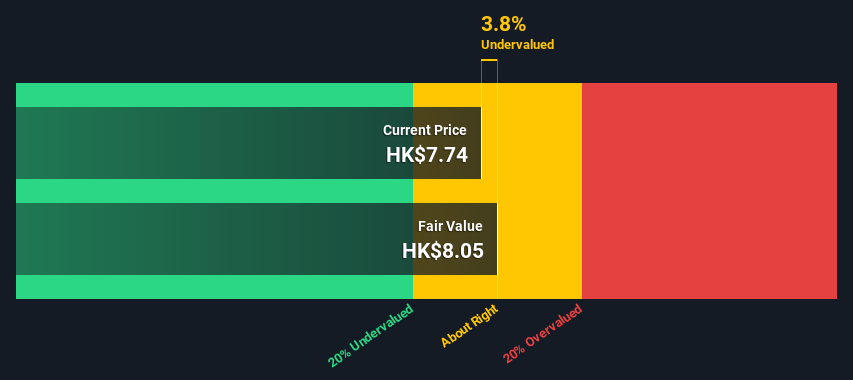
The total value, or equity value, is then the sum of the present value of the future cash flows, which in this case is CN¥12b. In the final step we divide the equity value by the number of shares outstanding. Relative to the current share price of HK$7.7, the company appears about fair value at a 3.8% discount to where the stock price trades currently. Remember though, that this is just an approximate valuation, and like any complex formula - garbage in, garbage out.
The assumptions
Now the most important inputs to a discounted cash flow are the discount rate, and of course, the actual cash flows. You don't have to agree with these inputs, I recommend redoing the calculations yourself and playing with them. The DCF also does not consider the possible cyclicality of an industry, or a company's future capital requirements, so it does not give a full picture of a company's potential performance. Given that we are looking at Zhengzhou Coal Mining Machinery Group as potential shareholders, the cost of equity is used as the discount rate, rather than the cost of capital (or weighted average cost of capital, WACC) which accounts for debt. In this calculation we've used 7.9%, which is based on a levered beta of 1.283. Beta is a measure of a stock's volatility, compared to the market as a whole. We get our beta from the industry average beta of globally comparable companies, with an imposed limit between 0.8 and 2.0, which is a reasonable range for a stable business.
Next Steps:
Whilst important, the DCF calculation is only one of many factors that you need to assess for a company. The DCF model is not a perfect stock valuation tool. Rather it should be seen as a guide to "what assumptions need to be true for this stock to be under/overvalued?" For instance, if the terminal value growth rate is adjusted slightly, it can dramatically alter the overall result. For Zhengzhou Coal Mining Machinery Group, we've compiled three additional items you should explore:
- Risks: Case in point, we've spotted 5 warning signs for Zhengzhou Coal Mining Machinery Group you should be aware of.
- Future Earnings: How does 564's growth rate compare to its peers and the wider market? Dig deeper into the analyst consensus number for the upcoming years by interacting with our free analyst growth expectation chart.
- Other High Quality Alternatives: Do you like a good all-rounder? Explore our interactive list of high quality stocks to get an idea of what else is out there you may be missing!
PS. Simply Wall St updates its DCF calculation for every Hong Kong stock every day, so if you want to find the intrinsic value of any other stock just search here.
Valuation is complex, but we're here to simplify it.
Discover if Zhengzhou Coal Mining Machinery Group might be undervalued or overvalued with our detailed analysis, featuring fair value estimates, potential risks, dividends, insider trades, and its financial condition.
Access Free AnalysisThis article by Simply Wall St is general in nature. We provide commentary based on historical data and analyst forecasts only using an unbiased methodology and our articles are not intended to be financial advice. It does not constitute a recommendation to buy or sell any stock, and does not take account of your objectives, or your financial situation. We aim to bring you long-term focused analysis driven by fundamental data. Note that our analysis may not factor in the latest price-sensitive company announcements or qualitative material. Simply Wall St has no position in any stocks mentioned.
Have feedback on this article? Concerned about the content? Get in touch with us directly. Alternatively, email editorial-team (at) simplywallst.com.
About SEHK:564
Zhengzhou Coal Mining Machinery Group
Manufactures and sells coal mining and excavating equipment for coal mining industry in the People’s Republic of China, Germany, and internationally.
Flawless balance sheet and undervalued.
Similar Companies
Market Insights

Community Narratives

