
Advertisement
- Hong Kong
- /
- Electrical
- /
- SEHK:505
Xingye Alloy Materials Group's (HKG:505) Shareholders May Want To Dig Deeper Than Statutory Profit

The recent earnings posted by Xingye Alloy Materials Group Limited (HKG:505) were solid, but the stock didn't move as much as we expected. However the statutory profit number doesn't tell the whole story, and we have found some factors which might be of concern to shareholders.
Check out our latest analysis for Xingye Alloy Materials Group
A Closer Look At Xingye Alloy Materials Group's Earnings
Many investors haven't heard of the accrual ratio from cashflow, but it is actually a useful measure of how well a company's profit is backed up by free cash flow (FCF) during a given period. The accrual ratio subtracts the FCF from the profit for a given period, and divides the result by the average operating assets of the company over that time. You could think of the accrual ratio from cashflow as the 'non-FCF profit ratio'.
That means a negative accrual ratio is a good thing, because it shows that the company is bringing in more free cash flow than its profit would suggest. While it's not a problem to have a positive accrual ratio, indicating a certain level of non-cash profits, a high accrual ratio is arguably a bad thing, because it indicates paper profits are not matched by cash flow. To quote a 2014 paper by Lewellen and Resutek, "firms with higher accruals tend to be less profitable in the future".
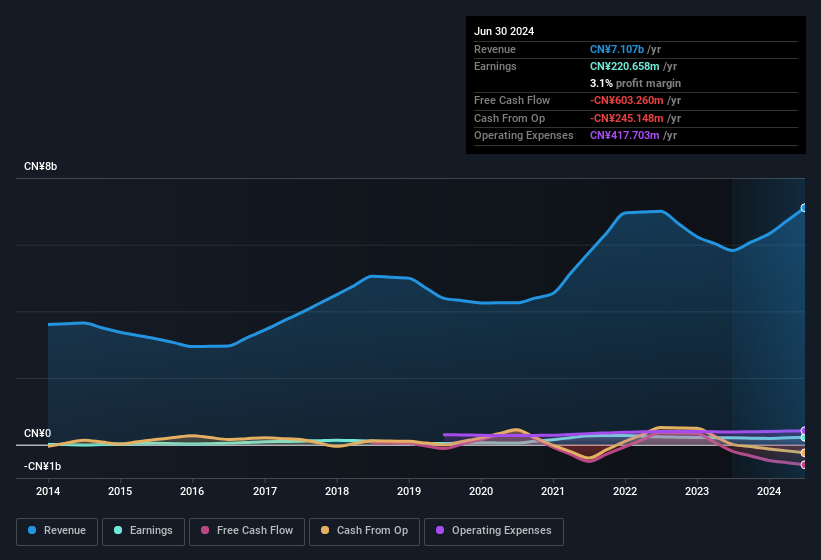
For the year to June 2024, Xingye Alloy Materials Group had an accrual ratio of 0.29. We can therefore deduce that its free cash flow fell well short of covering its statutory profit, suggesting we might want to think twice before putting a lot of weight on the latter. Over the last year it actually had negative free cash flow of CN¥603m, in contrast to the aforementioned profit of CN¥220.7m. We also note that Xingye Alloy Materials Group's free cash flow was actually negative last year as well, so we could understand if shareholders were bothered by its outflow of CN¥603m.
Note: we always recommend investors check balance sheet strength. Click here to be taken to our balance sheet analysis of Xingye Alloy Materials Group.
Our Take On Xingye Alloy Materials Group's Profit Performance
Xingye Alloy Materials Group didn't convert much of its profit to free cash flow in the last year, which some investors may consider rather suboptimal. Because of this, we think that it may be that Xingye Alloy Materials Group's statutory profits are better than its underlying earnings power. But at least holders can take some solace from the 8.9% EPS growth in the last year. At the end of the day, it's essential to consider more than just the factors above, if you want to understand the company properly. So while earnings quality is important, it's equally important to consider the risks facing Xingye Alloy Materials Group at this point in time. While conducting our analysis, we found that Xingye Alloy Materials Group has 2 warning signs and it would be unwise to ignore them.
This note has only looked at a single factor that sheds light on the nature of Xingye Alloy Materials Group's profit. But there is always more to discover if you are capable of focussing your mind on minutiae. Some people consider a high return on equity to be a good sign of a quality business. While it might take a little research on your behalf, you may find this free collection of companies boasting high return on equity, or this list of stocks with significant insider holdings to be useful.
New: AI Stock Screener & Alerts
Our new AI Stock Screener scans the market every day to uncover opportunities.
• Dividend Powerhouses (3%+ Yield)
• Undervalued Small Caps with Insider Buying
• High growth Tech and AI Companies
Or build your own from over 50 metrics.
Have feedback on this article? Concerned about the content? Get in touch with us directly. Alternatively, email editorial-team (at) simplywallst.com.
This article by Simply Wall St is general in nature. We provide commentary based on historical data and analyst forecasts only using an unbiased methodology and our articles are not intended to be financial advice. It does not constitute a recommendation to buy or sell any stock, and does not take account of your objectives, or your financial situation. We aim to bring you long-term focused analysis driven by fundamental data. Note that our analysis may not factor in the latest price-sensitive company announcements or qualitative material. Simply Wall St has no position in any stocks mentioned.
About SEHK:505
Xingye Alloy Materials Group
Manufactures and trades in high precision copper plates and strips in Mainland China, South Korea, Taiwan, Hong Kong, Singapore, Bangladesh, Thailand, India, and internationally.
Solid track record with excellent balance sheet.
Market Insights

Advertisement
Community Narratives

BMW cruising ahead with new EVs and premium models to boost revenue 5%
Fair Value €135.07|44.5% undervalued
UN
Community Contributor
EU#2 - From Humble Beginnings to Global Powerhouse
Fair Value DKK 851.04|46.1% undervalued
TO
Community Contributor