
Advertisement
- Hong Kong
- /
- Construction
- /
- SEHK:385
Returns On Capital Signal Difficult Times Ahead For Chinney Alliance Group (HKG:385)

What financial metrics can indicate to us that a company is maturing or even in decline? When we see a declining return on capital employed (ROCE) in conjunction with a declining base of capital employed, that's often how a mature business shows signs of aging. This combination can tell you that not only is the company investing less, it's earning less on what it does invest. Having said that, after a brief look, Chinney Alliance Group (HKG:385) we aren't filled with optimism, but let's investigate further.
Return On Capital Employed (ROCE): What Is It?
For those who don't know, ROCE is a measure of a company's yearly pre-tax profit (its return), relative to the capital employed in the business. Analysts use this formula to calculate it for Chinney Alliance Group:
Return on Capital Employed = Earnings Before Interest and Tax (EBIT) ÷ (Total Assets - Current Liabilities)
0.081 = HK$197m ÷ (HK$5.9b - HK$3.5b) (Based on the trailing twelve months to June 2024).
Thus, Chinney Alliance Group has an ROCE of 8.1%. In absolute terms, that's a low return, but it's much better than the Construction industry average of 5.9%.
See our latest analysis for Chinney Alliance Group
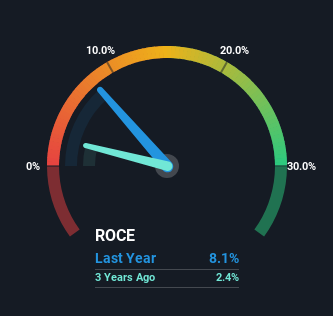
Historical performance is a great place to start when researching a stock so above you can see the gauge for Chinney Alliance Group's ROCE against it's prior returns. If you'd like to look at how Chinney Alliance Group has performed in the past in other metrics, you can view this free graph of Chinney Alliance Group's past earnings, revenue and cash flow.
What Does the ROCE Trend For Chinney Alliance Group Tell Us?
There is reason to be cautious about Chinney Alliance Group, given the returns are trending downwards. About five years ago, returns on capital were 12%, however they're now substantially lower than that as we saw above. Meanwhile, capital employed in the business has stayed roughly the flat over the period. This combination can be indicative of a mature business that still has areas to deploy capital, but the returns received aren't as high due potentially to new competition or smaller margins. If these trends continue, we wouldn't expect Chinney Alliance Group to turn into a multi-bagger.
On a side note, Chinney Alliance Group's current liabilities have increased over the last five years to 59% of total assets, effectively distorting the ROCE to some degree. Without this increase, it's likely that ROCE would be even lower than 8.1%. And with current liabilities at these levels, suppliers or short-term creditors are effectively funding a large part of the business, which can introduce some risks.
Our Take On Chinney Alliance Group's ROCE
All in all, the lower returns from the same amount of capital employed aren't exactly signs of a compounding machine. It should come as no surprise then that the stock has fallen 50% over the last five years, so it looks like investors are recognizing these changes. That being the case, unless the underlying trends revert to a more positive trajectory, we'd consider looking elsewhere.
If you want to know some of the risks facing Chinney Alliance Group we've found 3 warning signs (1 makes us a bit uncomfortable!) that you should be aware of before investing here.
While Chinney Alliance Group may not currently earn the highest returns, we've compiled a list of companies that currently earn more than 25% return on equity. Check out this free list here.
New: AI Stock Screener & Alerts
Our new AI Stock Screener scans the market every day to uncover opportunities.
• Dividend Powerhouses (3%+ Yield)
• Undervalued Small Caps with Insider Buying
• High growth Tech and AI Companies
Or build your own from over 50 metrics.
Have feedback on this article? Concerned about the content? Get in touch with us directly. Alternatively, email editorial-team (at) simplywallst.com.
This article by Simply Wall St is general in nature. We provide commentary based on historical data and analyst forecasts only using an unbiased methodology and our articles are not intended to be financial advice. It does not constitute a recommendation to buy or sell any stock, and does not take account of your objectives, or your financial situation. We aim to bring you long-term focused analysis driven by fundamental data. Note that our analysis may not factor in the latest price-sensitive company announcements or qualitative material. Simply Wall St has no position in any stocks mentioned.
About SEHK:385
Chinney Alliance Group
An investment holding company, provides building related contracting services for public and private sectors in Hong Kong, Mainland China, and Macau.
Proven track record with adequate balance sheet.
Market Insights

Advertisement
Community Narratives

BMW cruising ahead with new EVs and premium models to boost revenue 5%
Fair Value €135.07|44.6% undervalued
UN
Community Contributor
EU#2 - From Humble Beginnings to Global Powerhouse
Fair Value DKK 851.04|46.4% undervalued
TO
Community Contributor