The Returns At China PengFei Group (HKG:3348) Aren't Growing


Did you know there are some financial metrics that can provide clues of a potential multi-bagger? Firstly, we'd want to identify a growing return on capital employed (ROCE) and then alongside that, an ever-increasing base of capital employed. Ultimately, this demonstrates that it's a business that is reinvesting profits at increasing rates of return. So, when we ran our eye over China PengFei Group's (HKG:3348) trend of ROCE, we liked what we saw.
Understanding Return On Capital Employed (ROCE)
For those who don't know, ROCE is a measure of a company's yearly pre-tax profit (its return), relative to the capital employed in the business. Analysts use this formula to calculate it for China PengFei Group:
Return on Capital Employed = Earnings Before Interest and Tax (EBIT) ÷ (Total Assets - Current Liabilities)
0.15 = CN¥131m ÷ (CN¥2.9b - CN¥2.0b) (Based on the trailing twelve months to June 2023).
So, China PengFei Group has an ROCE of 15%. In absolute terms, that's a satisfactory return, but compared to the Machinery industry average of 7.4% it's much better.
View our latest analysis for China PengFei Group
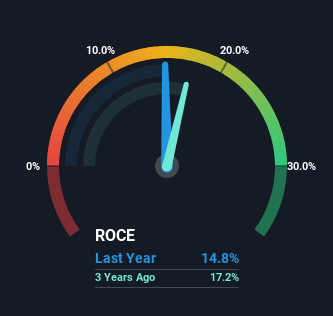
Historical performance is a great place to start when researching a stock so above you can see the gauge for China PengFei Group's ROCE against it's prior returns. If you want to delve into the historical earnings, revenue and cash flow of China PengFei Group, check out these free graphs here.
What Can We Tell From China PengFei Group's ROCE Trend?
While the returns on capital are good, they haven't moved much. Over the past five years, ROCE has remained relatively flat at around 15% and the business has deployed 127% more capital into its operations. Since 15% is a moderate ROCE though, it's good to see a business can continue to reinvest at these decent rates of return. Over long periods of time, returns like these might not be too exciting, but with consistency they can pay off in terms of share price returns.
Another thing to note, China PengFei Group has a high ratio of current liabilities to total assets of 70%. This can bring about some risks because the company is basically operating with a rather large reliance on its suppliers or other sorts of short-term creditors. While it's not necessarily a bad thing, it can be beneficial if this ratio is lower.
In Conclusion...
In the end, China PengFei Group has proven its ability to adequately reinvest capital at good rates of return. However, over the last three years, the stock has only delivered a 2.4% return to shareholders who held over that period. So because of the trends we're seeing, we'd recommend looking further into this stock to see if it has the makings of a multi-bagger.
One more thing: We've identified 3 warning signs with China PengFei Group (at least 1 which doesn't sit too well with us) , and understanding these would certainly be useful.
While China PengFei Group may not currently earn the highest returns, we've compiled a list of companies that currently earn more than 25% return on equity. Check out this free list here.
New: AI Stock Screener & Alerts
Our new AI Stock Screener scans the market every day to uncover opportunities.
• Dividend Powerhouses (3%+ Yield)
• Undervalued Small Caps with Insider Buying
• High growth Tech and AI Companies
Or build your own from over 50 metrics.
Have feedback on this article? Concerned about the content? Get in touch with us directly. Alternatively, email editorial-team (at) simplywallst.com.
This article by Simply Wall St is general in nature. We provide commentary based on historical data and analyst forecasts only using an unbiased methodology and our articles are not intended to be financial advice. It does not constitute a recommendation to buy or sell any stock, and does not take account of your objectives, or your financial situation. We aim to bring you long-term focused analysis driven by fundamental data. Note that our analysis may not factor in the latest price-sensitive company announcements or qualitative material. Simply Wall St has no position in any stocks mentioned.
About SEHK:3348
China PengFei Group
An investment holding company, manufactures and installs rotary kilns, grinding equipment, and related equipment in Mainland China and internationally.
Flawless balance sheet and good value.
Market Insights

Community Narratives

