- Hong Kong
- /
- Industrials
- /
- SEHK:274
Market Might Still Lack Some Conviction On Renaissance Asia Silk Road Group Limited (HKG:274) Even After 104% Share Price Boost


Renaissance Asia Silk Road Group Limited (HKG:274) shareholders would be excited to see that the share price has had a great month, posting a 104% gain and recovering from prior weakness. Still, the 30-day jump doesn't change the fact that longer term shareholders have seen their stock decimated by the 63% share price drop in the last twelve months.
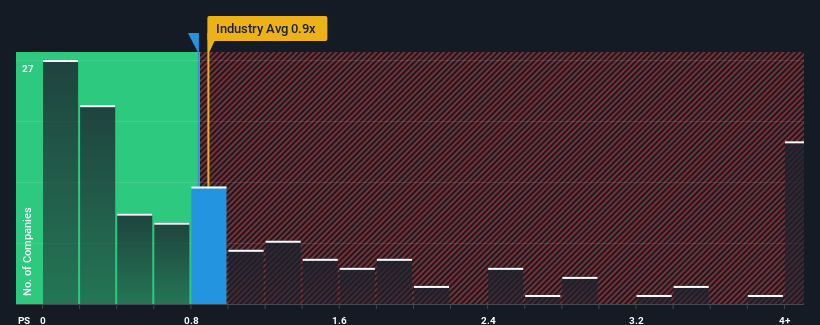
In spite of the firm bounce in price, it's still not a stretch to say that Renaissance Asia Silk Road Group's price-to-sales (or "P/S") ratio of 0.8x right now seems quite "middle-of-the-road" compared to the Industrials industry in Hong Kong, where the median P/S ratio is around 0.5x. While this might not raise any eyebrows, if the P/S ratio is not justified investors could be missing out on a potential opportunity or ignoring looming disappointment.
See our latest analysis for Renaissance Asia Silk Road Group
How Has Renaissance Asia Silk Road Group Performed Recently?
Recent times have been quite advantageous for Renaissance Asia Silk Road Group as its revenue has been rising very briskly. The P/S is probably moderate because investors think this strong revenue growth might not be enough to outperform the broader industry in the near future. Those who are bullish on Renaissance Asia Silk Road Group will be hoping that this isn't the case, so that they can pick up the stock at a lower valuation.
Want the full picture on earnings, revenue and cash flow for the company? Then our free report on Renaissance Asia Silk Road Group will help you shine a light on its historical performance.Is There Some Revenue Growth Forecasted For Renaissance Asia Silk Road Group?
The only time you'd be comfortable seeing a P/S like Renaissance Asia Silk Road Group's is when the company's growth is tracking the industry closely.
If we review the last year of revenue growth, the company posted a terrific increase of 96%. This great performance means it was also able to deliver immense revenue growth over the last three years. Accordingly, shareholders would have been over the moon with those medium-term rates of revenue growth.
Comparing that to the industry, which is only predicted to deliver 16% growth in the next 12 months, the company's momentum is stronger based on recent medium-term annualised revenue results.
In light of this, it's curious that Renaissance Asia Silk Road Group's P/S sits in line with the majority of other companies. It may be that most investors are not convinced the company can maintain its recent growth rates.
The Bottom Line On Renaissance Asia Silk Road Group's P/S
Its shares have lifted substantially and now Renaissance Asia Silk Road Group's P/S is back within range of the industry median. Generally, our preference is to limit the use of the price-to-sales ratio to establishing what the market thinks about the overall health of a company.
We've established that Renaissance Asia Silk Road Group currently trades on a lower than expected P/S since its recent three-year growth is higher than the wider industry forecast. There could be some unobserved threats to revenue preventing the P/S ratio from matching this positive performance. It appears some are indeed anticipating revenue instability, because the persistence of these recent medium-term conditions would normally provide a boost to the share price.
Having said that, be aware Renaissance Asia Silk Road Group is showing 4 warning signs in our investment analysis, and 1 of those is significant.
Of course, profitable companies with a history of great earnings growth are generally safer bets. So you may wish to see this free collection of other companies that have reasonable P/E ratios and have grown earnings strongly.
If you're looking to trade Renaissance Asia Silk Road Group, open an account with the lowest-cost platform trusted by professionals, Interactive Brokers.
With clients in over 200 countries and territories, and access to 160 markets, IBKR lets you trade stocks, options, futures, forex, bonds and funds from a single integrated account.
Enjoy no hidden fees, no account minimums, and FX conversion rates as low as 0.03%, far better than what most brokers offer.
Sponsored ContentNew: AI Stock Screener & Alerts
Our new AI Stock Screener scans the market every day to uncover opportunities.
• Dividend Powerhouses (3%+ Yield)
• Undervalued Small Caps with Insider Buying
• High growth Tech and AI Companies
Or build your own from over 50 metrics.
Have feedback on this article? Concerned about the content? Get in touch with us directly. Alternatively, email editorial-team (at) simplywallst.com.
This article by Simply Wall St is general in nature. We provide commentary based on historical data and analyst forecasts only using an unbiased methodology and our articles are not intended to be financial advice. It does not constitute a recommendation to buy or sell any stock, and does not take account of your objectives, or your financial situation. We aim to bring you long-term focused analysis driven by fundamental data. Note that our analysis may not factor in the latest price-sensitive company announcements or qualitative material. Simply Wall St has no position in any stocks mentioned.
About SEHK:274
Renaissance Asia Silk Road Group
An investment holding company, engages in the exploration, mining, trading, and sale of gold products in the People's Republic of China.
Slight and slightly overvalued.
Market Insights

Community Narratives

