- Hong Kong
- /
- Construction
- /
- SEHK:2163
Introducing Changsha Broad Homes Industrial Group (HKG:2163), The Stock That Zoomed 112% In The Last Year


Some Changsha Broad Homes Industrial Group Co., Ltd. (HKG:2163) shareholders are probably rather concerned to see the share price fall 42% over the last three months. But that doesn't change the fact that the returns over the last year have been very strong. Like an eagle, the share price soared 112% in that time. So we think most shareholders won't be too upset about the recent fall. The real question is whether the business is trending in the right direction.
View our latest analysis for Changsha Broad Homes Industrial Group
To quote Buffett, 'Ships will sail around the world but the Flat Earth Society will flourish. There will continue to be wide discrepancies between price and value in the marketplace...' One way to examine how market sentiment has changed over time is to look at the interaction between a company's share price and its earnings per share (EPS).
During the last year, Changsha Broad Homes Industrial Group actually saw its earnings per share drop 24%.
This means it's unlikely the market is judging the company based on earnings growth. Indeed, when EPS is declining but the share price is up, it often means the market is considering other factors.
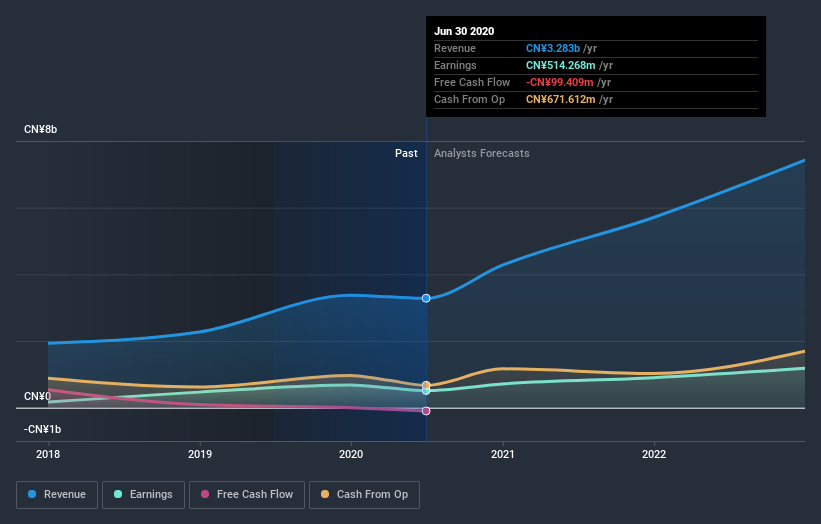
However the year on year revenue growth of 17% would help. We do see some companies suppress earnings in order to accelerate revenue growth.
You can see below how earnings and revenue have changed over time (discover the exact values by clicking on the image).
We consider it positive that insiders have made significant purchases in the last year. Having said that, most people consider earnings and revenue growth trends to be a more meaningful guide to the business. This free report showing analyst forecasts should help you form a view on Changsha Broad Homes Industrial Group
What About Dividends?
When looking at investment returns, it is important to consider the difference between total shareholder return (TSR) and share price return. The TSR incorporates the value of any spin-offs or discounted capital raisings, along with any dividends, based on the assumption that the dividends are reinvested. Arguably, the TSR gives a more comprehensive picture of the return generated by a stock. In the case of Changsha Broad Homes Industrial Group, it has a TSR of 125% for the last year. That exceeds its share price return that we previously mentioned. This is largely a result of its dividend payments!
A Different Perspective
It's nice to see that Changsha Broad Homes Industrial Group shareholders have gained 125% over the last year, including dividends. We regret to report that the share price is down 42% over ninety days. It may simply be that the share price got ahead of itself, although there may have been fundamental developments that are weighing on it. While it is well worth considering the different impacts that market conditions can have on the share price, there are other factors that are even more important. To that end, you should be aware of the 4 warning signs we've spotted with Changsha Broad Homes Industrial Group .
Changsha Broad Homes Industrial Group is not the only stock insiders are buying. So take a peek at this free list of growing companies with insider buying.
Please note, the market returns quoted in this article reflect the market weighted average returns of stocks that currently trade on HK exchanges.
If you decide to trade Changsha Broad Homes Industrial Group, use the lowest-cost* platform that is rated #1 Overall by Barron’s, Interactive Brokers. Trade stocks, options, futures, forex, bonds and funds on 135 markets, all from a single integrated account. Promoted
If you're looking to trade Changsha Broad Homes Industrial Group, open an account with the lowest-cost platform trusted by professionals, Interactive Brokers.
With clients in over 200 countries and territories, and access to 160 markets, IBKR lets you trade stocks, options, futures, forex, bonds and funds from a single integrated account.
Enjoy no hidden fees, no account minimums, and FX conversion rates as low as 0.03%, far better than what most brokers offer.
Sponsored ContentNew: AI Stock Screener & Alerts
Our new AI Stock Screener scans the market every day to uncover opportunities.
• Dividend Powerhouses (3%+ Yield)
• Undervalued Small Caps with Insider Buying
• High growth Tech and AI Companies
Or build your own from over 50 metrics.
This article by Simply Wall St is general in nature. It does not constitute a recommendation to buy or sell any stock, and does not take account of your objectives, or your financial situation. We aim to bring you long-term focused analysis driven by fundamental data. Note that our analysis may not factor in the latest price-sensitive company announcements or qualitative material. Simply Wall St has no position in any stocks mentioned.
*Interactive Brokers Rated Lowest Cost Broker by StockBrokers.com Annual Online Review 2020
Have feedback on this article? Concerned about the content? Get in touch with us directly. Alternatively, email editorial-team (at) simplywallst.com.
About SEHK:2163
Changsha Broad Homes Industrial Group
Changsha Broad Homes Industrial Group Co., Ltd.
Good value low.
Similar Companies
Market Insights

Community Narratives

