
Advertisement
- Hong Kong
- /
- Construction
- /
- SEHK:2163
Changsha Broad Homes Industrial Group (HKG:2163) Is Reinvesting At Lower Rates Of Return

Did you know there are some financial metrics that can provide clues of a potential multi-bagger? Ideally, a business will show two trends; firstly a growing return on capital employed (ROCE) and secondly, an increasing amount of capital employed. Ultimately, this demonstrates that it's a business that is reinvesting profits at increasing rates of return. In light of that, when we looked at Changsha Broad Homes Industrial Group (HKG:2163) and its ROCE trend, we weren't exactly thrilled.
Understanding Return On Capital Employed (ROCE)
Just to clarify if you're unsure, ROCE is a metric for evaluating how much pre-tax income (in percentage terms) a company earns on the capital invested in its business. To calculate this metric for Changsha Broad Homes Industrial Group, this is the formula:
Return on Capital Employed = Earnings Before Interest and Tax (EBIT) ÷ (Total Assets - Current Liabilities)
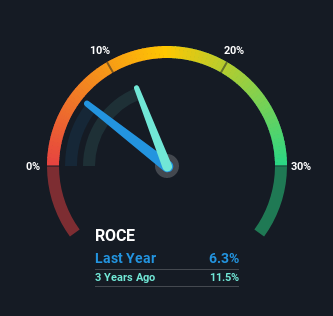
0.063 = CN¥334m ÷ (CN¥9.2b - CN¥3.9b) (Based on the trailing twelve months to December 2020).
Therefore, Changsha Broad Homes Industrial Group has an ROCE of 6.3%. In absolute terms, that's a low return and it also under-performs the Construction industry average of 9.1%.
Check out our latest analysis for Changsha Broad Homes Industrial Group
In the above chart we have measured Changsha Broad Homes Industrial Group's prior ROCE against its prior performance, but the future is arguably more important. If you'd like, you can check out the forecasts from the analysts covering Changsha Broad Homes Industrial Group here for free.
What Can We Tell From Changsha Broad Homes Industrial Group's ROCE Trend?
In terms of Changsha Broad Homes Industrial Group's historical ROCE movements, the trend isn't fantastic. To be more specific, ROCE has fallen from 12% over the last five years. And considering revenue has dropped while employing more capital, we'd be cautious. This could mean that the business is losing its competitive advantage or market share, because while more money is being put into ventures, it's actually producing a lower return - "less bang for their buck" per se.
On a side note, Changsha Broad Homes Industrial Group has done well to pay down its current liabilities to 42% of total assets. So we could link some of this to the decrease in ROCE. What's more, this can reduce some aspects of risk to the business because now the company's suppliers or short-term creditors are funding less of its operations. Some would claim this reduces the business' efficiency at generating ROCE since it is now funding more of the operations with its own money. Either way, they're still at a pretty high level, so we'd like to see them fall further if possible.
The Bottom Line On Changsha Broad Homes Industrial Group's ROCE
From the above analysis, we find it rather worrisome that returns on capital and sales for Changsha Broad Homes Industrial Group have fallen, meanwhile the business is employing more capital than it was five years ago. The market must be rosy on the stock's future because even though the underlying trends aren't too encouraging, the stock has soared 113%. Regardless, we don't feel too comfortable with the fundamentals so we'd be steering clear of this stock for now.
If you'd like to know more about Changsha Broad Homes Industrial Group, we've spotted 4 warning signs, and 1 of them shouldn't be ignored.
For those who like to invest in solid companies, check out this free list of companies with solid balance sheets and high returns on equity.
If you decide to trade Changsha Broad Homes Industrial Group, use the lowest-cost* platform that is rated #1 Overall by Barron’s, Interactive Brokers. Trade stocks, options, futures, forex, bonds and funds on 135 markets, all from a single integrated account. Promoted
New: AI Stock Screener & Alerts
Our new AI Stock Screener scans the market every day to uncover opportunities.
• Dividend Powerhouses (3%+ Yield)
• Undervalued Small Caps with Insider Buying
• High growth Tech and AI Companies
Or build your own from over 50 metrics.
This article by Simply Wall St is general in nature. It does not constitute a recommendation to buy or sell any stock, and does not take account of your objectives, or your financial situation. We aim to bring you long-term focused analysis driven by fundamental data. Note that our analysis may not factor in the latest price-sensitive company announcements or qualitative material. Simply Wall St has no position in any stocks mentioned.
*Interactive Brokers Rated Lowest Cost Broker by StockBrokers.com Annual Online Review 2020
Have feedback on this article? Concerned about the content? Get in touch with us directly. Alternatively, email editorial-team (at) simplywallst.com.
About SEHK:2163
Changsha Broad Homes Industrial Group
Changsha Broad Homes Industrial Group Co., Ltd.
Good value low.
Similar Companies
Market Insights

Advertisement
Community Narratives
Groundbreaking therapies that could change the treatment landscape for PTSD, fibromyalgia, MS & Alzheimer’s
Fair Value US$6.20|86.9% undervalued
CM
Community Contributor
DigitalOcean Will Grow 14% by Embracing AI with Paperspace Acquisition
Fair Value US$50.00|41.7% undervalued
NE
Community Contributor
Viant Technology: A Rising AdTech Challenger in the AI-Powered CTV Market
Fair Value US$38.61|63.2% undervalued
BL
Community Contributor
Volvo will Accelerate Forward into Electric and Autonomous Leadership in Five Years
Fair Value SEK 438.80|39.7% undervalued
UN
Community Contributor