
Advertisement
- Hong Kong
- /
- Electrical
- /
- SEHK:1729
Here's What To Make Of Time Interconnect Technology's (HKG:1729) Returns On Capital

If you're not sure where to start when looking for the next multi-bagger, there are a few key trends you should keep an eye out for. Amongst other things, we'll want to see two things; firstly, a growing return on capital employed (ROCE) and secondly, an expansion in the company's amount of capital employed. This shows us that it's a compounding machine, able to continually reinvest its earnings back into the business and generate higher returns. However, after briefly looking over the numbers, we don't think Time Interconnect Technology (HKG:1729) has the makings of a multi-bagger going forward, but let's have a look at why that may be.
What is Return On Capital Employed (ROCE)?
If you haven't worked with ROCE before, it measures the 'return' (pre-tax profit) a company generates from capital employed in its business. To calculate this metric for Time Interconnect Technology, this is the formula:
Return on Capital Employed = Earnings Before Interest and Tax (EBIT) ÷ (Total Assets - Current Liabilities)
0.16 = HK$205m ÷ (HK$2.4b - HK$1.1b) (Based on the trailing twelve months to September 2020).
So, Time Interconnect Technology has an ROCE of 16%. On its own, that's a standard return, however it's much better than the 8.9% generated by the Electrical industry.
View our latest analysis for Time Interconnect Technology
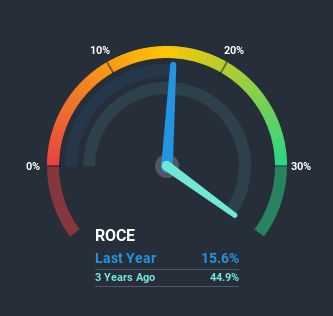
Historical performance is a great place to start when researching a stock so above you can see the gauge for Time Interconnect Technology's ROCE against it's prior returns. If you're interested in investigating Time Interconnect Technology's past further, check out this free graph of past earnings, revenue and cash flow.
What Does the ROCE Trend For Time Interconnect Technology Tell Us?
In terms of Time Interconnect Technology's historical ROCE movements, the trend isn't fantastic. Around five years ago the returns on capital were 39%, but since then they've fallen to 16%. And considering revenue has dropped while employing more capital, we'd be cautious. This could mean that the business is losing its competitive advantage or market share, because while more money is being put into ventures, it's actually producing a lower return - "less bang for their buck" per se.
On a side note, Time Interconnect Technology has done well to pay down its current liabilities to 46% of total assets. So we could link some of this to the decrease in ROCE. Effectively this means their suppliers or short-term creditors are funding less of the business, which reduces some elements of risk. Since the business is basically funding more of its operations with it's own money, you could argue this has made the business less efficient at generating ROCE. Keep in mind 46% is still pretty high, so those risks are still somewhat prevalent.
The Bottom Line On Time Interconnect Technology's ROCE
We're a bit apprehensive about Time Interconnect Technology because despite more capital being deployed in the business, returns on that capital and sales have both fallen. However the stock has delivered a 47% return to shareholders over the last year, so investors might be expecting the trends to turn around. Regardless, we don't feel too comfortable with the fundamentals so we'd be steering clear of this stock for now.
Time Interconnect Technology does have some risks, we noticed 4 warning signs (and 2 which shouldn't be ignored) we think you should know about.
For those who like to invest in solid companies, check out this free list of companies with solid balance sheets and high returns on equity.
If you decide to trade Time Interconnect Technology, use the lowest-cost* platform that is rated #1 Overall by Barron’s, Interactive Brokers. Trade stocks, options, futures, forex, bonds and funds on 135 markets, all from a single integrated account. Promoted
Valuation is complex, but we're here to simplify it.
Discover if Time Interconnect Technology might be undervalued or overvalued with our detailed analysis, featuring fair value estimates, potential risks, dividends, insider trades, and its financial condition.
Access Free AnalysisThis article by Simply Wall St is general in nature. It does not constitute a recommendation to buy or sell any stock, and does not take account of your objectives, or your financial situation. We aim to bring you long-term focused analysis driven by fundamental data. Note that our analysis may not factor in the latest price-sensitive company announcements or qualitative material. Simply Wall St has no position in any stocks mentioned.
*Interactive Brokers Rated Lowest Cost Broker by StockBrokers.com Annual Online Review 2020
Have feedback on this article? Concerned about the content? Get in touch with us directly. Alternatively, email editorial-team (at) simplywallst.com.
About SEHK:1729
Time Interconnect Technology
An investment holding company, manufactures and sells cable assembly and networking cable products in the People's Republic of China, the United States, the Netherlands, Singapore, the United Kingdom, Hong Kong, Mexico, and internationally.
Adequate balance sheet and fair value.
Market Insights


Advertisement
Community Narratives
Nike's Direct-to-Consumer Focus Will Drive Future Growth
Fair Value US$87.90|18.2% undervalued
UN
Community Contributor
Novo Nordisk will dominate GLP-1 market with Ozempic and Wegovy growth
Fair Value US$89.59|12.1% undervalued
BE
Community Contributor
Rheinmetall could get 20-25% of EU-NATO 3%-GDP defence spending
Fair Value €7.57k|82.4% undervalued
NO
Community Contributor