- Hong Kong
- /
- Construction
- /
- SEHK:1472
Here's What's Concerning About Sang Hing Holdings (International)'s (HKG:1472) Returns On Capital


To find a multi-bagger stock, what are the underlying trends we should look for in a business? Amongst other things, we'll want to see two things; firstly, a growing return on capital employed (ROCE) and secondly, an expansion in the company's amount of capital employed. Basically this means that a company has profitable initiatives that it can continue to reinvest in, which is a trait of a compounding machine. Although, when we looked at Sang Hing Holdings (International) (HKG:1472), it didn't seem to tick all of these boxes.
Return On Capital Employed (ROCE): What is it?
For those that aren't sure what ROCE is, it measures the amount of pre-tax profits a company can generate from the capital employed in its business. The formula for this calculation on Sang Hing Holdings (International) is:
Return on Capital Employed = Earnings Before Interest and Tax (EBIT) ÷ (Total Assets - Current Liabilities)
0.035 = HK$11m ÷ (HK$387m - HK$66m) (Based on the trailing twelve months to September 2021).
Therefore, Sang Hing Holdings (International) has an ROCE of 3.5%. Ultimately, that's a low return and it under-performs the Construction industry average of 8.7%.
See our latest analysis for Sang Hing Holdings (International)
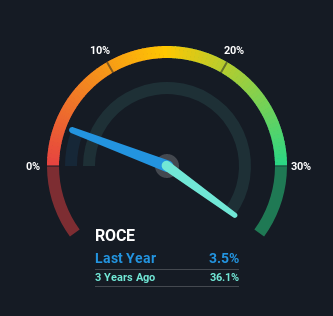
Historical performance is a great place to start when researching a stock so above you can see the gauge for Sang Hing Holdings (International)'s ROCE against it's prior returns. If you want to delve into the historical earnings, revenue and cash flow of Sang Hing Holdings (International), check out these free graphs here.
What Does the ROCE Trend For Sang Hing Holdings (International) Tell Us?
On the surface, the trend of ROCE at Sang Hing Holdings (International) doesn't inspire confidence. To be more specific, ROCE has fallen from 33% over the last four years. Given the business is employing more capital while revenue has slipped, this is a bit concerning. This could mean that the business is losing its competitive advantage or market share, because while more money is being put into ventures, it's actually producing a lower return - "less bang for their buck" per se.
On a related note, Sang Hing Holdings (International) has decreased its current liabilities to 17% of total assets. So we could link some of this to the decrease in ROCE. Effectively this means their suppliers or short-term creditors are funding less of the business, which reduces some elements of risk. Since the business is basically funding more of its operations with it's own money, you could argue this has made the business less efficient at generating ROCE.
The Bottom Line
From the above analysis, we find it rather worrisome that returns on capital and sales for Sang Hing Holdings (International) have fallen, meanwhile the business is employing more capital than it was four years ago. It should come as no surprise then that the stock has fallen 66% over the last year, so it looks like investors are recognizing these changes. Unless there is a shift to a more positive trajectory in these metrics, we would look elsewhere.
Since virtually every company faces some risks, it's worth knowing what they are, and we've spotted 4 warning signs for Sang Hing Holdings (International) (of which 2 are a bit concerning!) that you should know about.
For those who like to invest in solid companies, check out this free list of companies with solid balance sheets and high returns on equity.
If you're looking to trade Sang Hing Holdings (International), open an account with the lowest-cost platform trusted by professionals, Interactive Brokers.
With clients in over 200 countries and territories, and access to 160 markets, IBKR lets you trade stocks, options, futures, forex, bonds and funds from a single integrated account.
Enjoy no hidden fees, no account minimums, and FX conversion rates as low as 0.03%, far better than what most brokers offer.
Sponsored ContentNew: Manage All Your Stock Portfolios in One Place
We've created the ultimate portfolio companion for stock investors, and it's free.
• Connect an unlimited number of Portfolios and see your total in one currency
• Be alerted to new Warning Signs or Risks via email or mobile
• Track the Fair Value of your stocks
Have feedback on this article? Concerned about the content? Get in touch with us directly. Alternatively, email editorial-team (at) simplywallst.com.
This article by Simply Wall St is general in nature. We provide commentary based on historical data and analyst forecasts only using an unbiased methodology and our articles are not intended to be financial advice. It does not constitute a recommendation to buy or sell any stock, and does not take account of your objectives, or your financial situation. We aim to bring you long-term focused analysis driven by fundamental data. Note that our analysis may not factor in the latest price-sensitive company announcements or qualitative material. Simply Wall St has no position in any stocks mentioned.
About SEHK:1472
Sang Hing Holdings (International)
An investment holding company, provides civil engineering and related services in Hong Kong.
Flawless balance sheet low.
Market Insights

Community Narratives


