
Advertisement
Cosmos Machinery Enterprises' (HKG:118) Returns On Capital Not Reflecting Well On The Business

If you're looking at a mature business that's past the growth phase, what are some of the underlying trends that pop up? A business that's potentially in decline often shows two trends, a return on capital employed (ROCE) that's declining, and a base of capital employed that's also declining. Basically the company is earning less on its investments and it is also reducing its total assets. So after we looked into Cosmos Machinery Enterprises (HKG:118), the trends above didn't look too great.
Understanding Return On Capital Employed (ROCE)
For those that aren't sure what ROCE is, it measures the amount of pre-tax profits a company can generate from the capital employed in its business. Analysts use this formula to calculate it for Cosmos Machinery Enterprises:
Return on Capital Employed = Earnings Before Interest and Tax (EBIT) ÷ (Total Assets - Current Liabilities)
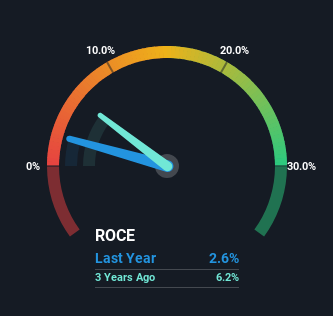
0.026 = HK$37m ÷ (HK$2.4b - HK$947m) (Based on the trailing twelve months to June 2024).
Thus, Cosmos Machinery Enterprises has an ROCE of 2.6%. Ultimately, that's a low return and it under-performs the Machinery industry average of 9.1%.
View our latest analysis for Cosmos Machinery Enterprises
While the past is not representative of the future, it can be helpful to know how a company has performed historically, which is why we have this chart above. If you'd like to look at how Cosmos Machinery Enterprises has performed in the past in other metrics, you can view this free graph of Cosmos Machinery Enterprises' past earnings, revenue and cash flow.
So How Is Cosmos Machinery Enterprises' ROCE Trending?
We are a bit worried about the trend of returns on capital at Cosmos Machinery Enterprises. To be more specific, the ROCE was 3.5% five years ago, but since then it has dropped noticeably. On top of that, it's worth noting that the amount of capital employed within the business has remained relatively steady. This combination can be indicative of a mature business that still has areas to deploy capital, but the returns received aren't as high due potentially to new competition or smaller margins. So because these trends aren't typically conducive to creating a multi-bagger, we wouldn't hold our breath on Cosmos Machinery Enterprises becoming one if things continue as they have.
On a separate but related note, it's important to know that Cosmos Machinery Enterprises has a current liabilities to total assets ratio of 40%, which we'd consider pretty high. This effectively means that suppliers (or short-term creditors) are funding a large portion of the business, so just be aware that this can introduce some elements of risk. Ideally we'd like to see this reduce as that would mean fewer obligations bearing risks.
The Bottom Line
In summary, it's unfortunate that Cosmos Machinery Enterprises is generating lower returns from the same amount of capital. Investors haven't taken kindly to these developments, since the stock has declined 37% from where it was five years ago. That being the case, unless the underlying trends revert to a more positive trajectory, we'd consider looking elsewhere.
One more thing: We've identified 3 warning signs with Cosmos Machinery Enterprises (at least 1 which is a bit unpleasant) , and understanding them would certainly be useful.
While Cosmos Machinery Enterprises isn't earning the highest return, check out this free list of companies that are earning high returns on equity with solid balance sheets.
New: AI Stock Screener & Alerts
Our new AI Stock Screener scans the market every day to uncover opportunities.
• Dividend Powerhouses (3%+ Yield)
• Undervalued Small Caps with Insider Buying
• High growth Tech and AI Companies
Or build your own from over 50 metrics.
Have feedback on this article? Concerned about the content? Get in touch with us directly. Alternatively, email editorial-team (at) simplywallst.com.
This article by Simply Wall St is general in nature. We provide commentary based on historical data and analyst forecasts only using an unbiased methodology and our articles are not intended to be financial advice. It does not constitute a recommendation to buy or sell any stock, and does not take account of your objectives, or your financial situation. We aim to bring you long-term focused analysis driven by fundamental data. Note that our analysis may not factor in the latest price-sensitive company announcements or qualitative material. Simply Wall St has no position in any stocks mentioned.
About SEHK:118
Cosmos Machinery Enterprises
An investment holding company, manufactures and sells machineries in Hong Kong, Mainland China, other Asia-Pacific countries, North America, and Europe.
Excellent balance sheet with questionable track record.
Market Insights

Advertisement
Community Narratives
Groundbreaking therapies that could change the treatment landscape for PTSD, fibromyalgia, MS & Alzheimer’s
Fair Value US$6.20|86.9% undervalued
CM
Community Contributor
DigitalOcean Will Grow 14% by Embracing AI with Paperspace Acquisition
Fair Value US$50.00|41.7% undervalued
NE
Community Contributor
Viant Technology: A Rising AdTech Challenger in the AI-Powered CTV Market
Fair Value US$38.61|63.2% undervalued
BL
Community Contributor
Volvo will Accelerate Forward into Electric and Autonomous Leadership in Five Years
Fair Value SEK 438.80|39.7% undervalued
UN
Community Contributor