- Hong Kong
- /
- Auto Components
- /
- SEHK:819
Revenue Beat: Tianneng Power International Limited Beat Analyst Estimates By 17%

Tianneng Power International Limited (HKG:819) shareholders are probably feeling a little disappointed, since its shares fell 2.9% to HK$14.68 in the week after its latest annual results. It was a mildly positive result, with revenues exceeding expectations at CN¥54b, while statutory earnings per share (EPS) of CN¥2.15 were in line with analyst forecasts. Following the result, the analysts have updated their earnings model, and it would be good to know whether they think there's been a strong change in the company's prospects, or if it's business as usual. Readers will be glad to know we've aggregated the latest statutory forecasts to see whether the analysts have changed their mind on Tianneng Power International after the latest results.
View our latest analysis for Tianneng Power International

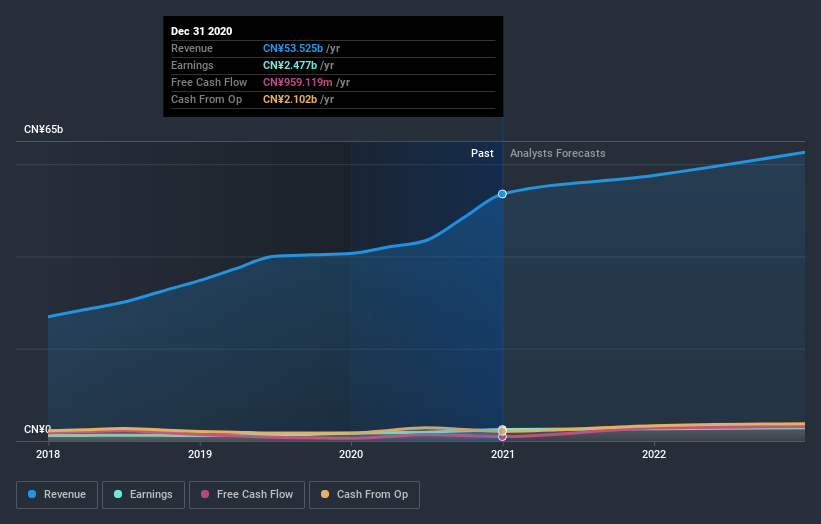
After the latest results, the two analysts covering Tianneng Power International are now predicting revenues of CN¥57.5b in 2021. If met, this would reflect a modest 7.5% improvement in sales compared to the last 12 months. Statutory earnings per share are predicted to accumulate 6.4% to CN¥2.34. In the lead-up to this report, the analysts had been modelling revenues of CN¥51.8b and earnings per share (EPS) of CN¥2.24 in 2021. The analysts seem more optimistic after the latest results, with a decent improvement in revenue and a slight bump in earnings per share estimates.
Althoughthe analysts have upgraded their earnings estimates, there was no change to the consensus price target of CN¥16.12, suggesting that the forecast performance does not have a long term impact on the company's valuation.
Looking at the bigger picture now, one of the ways we can make sense of these forecasts is to see how they measure up against both past performance and industry growth estimates. We would highlight that Tianneng Power International's revenue growth is expected to slow, with the forecast 7.5% annualised growth rate until the end of 2021 being well below the historical 21% p.a. growth over the last five years. By way of comparison, the other companies in this industry with analyst coverage are forecast to grow their revenue at 13% per year. So it's pretty clear that, while revenue growth is expected to slow down, the wider industry is also expected to grow faster than Tianneng Power International.
The Bottom Line
The most important thing here is that the analysts upgraded their earnings per share estimates, suggesting that there has been a clear increase in optimism towards Tianneng Power International following these results. They also upgraded their revenue estimates for next year, even though sales are expected to grow slower than the wider industry. There was no real change to the consensus price target, suggesting that the intrinsic value of the business has not undergone any major changes with the latest estimates.
Keeping that in mind, we still think that the longer term trajectory of the business is much more important for investors to consider. We have analyst estimates for Tianneng Power International going out as far as 2022, and you can see them free on our platform here.
You should always think about risks though. Case in point, we've spotted 3 warning signs for Tianneng Power International you should be aware of, and 1 of them shouldn't be ignored.
If you’re looking to trade Tianneng Power International, open an account with the lowest-cost* platform trusted by professionals, Interactive Brokers. Their clients from over 200 countries and territories trade stocks, options, futures, forex, bonds and funds worldwide from a single integrated account. Promoted
If you're looking to trade Tianneng Power International, open an account with the lowest-cost platform trusted by professionals, Interactive Brokers.
With clients in over 200 countries and territories, and access to 160 markets, IBKR lets you trade stocks, options, futures, forex, bonds and funds from a single integrated account.
Enjoy no hidden fees, no account minimums, and FX conversion rates as low as 0.03%, far better than what most brokers offer.
Sponsored ContentValuation is complex, but we're here to simplify it.
Discover if Tianneng Power International might be undervalued or overvalued with our detailed analysis, featuring fair value estimates, potential risks, dividends, insider trades, and its financial condition.
Access Free AnalysisThis article by Simply Wall St is general in nature. It does not constitute a recommendation to buy or sell any stock, and does not take account of your objectives, or your financial situation. We aim to bring you long-term focused analysis driven by fundamental data. Note that our analysis may not factor in the latest price-sensitive company announcements or qualitative material. Simply Wall St has no position in any stocks mentioned.
*Interactive Brokers Rated Lowest Cost Broker by StockBrokers.com Annual Online Review 2020
Have feedback on this article? Concerned about the content? Get in touch with us directly. Alternatively, email editorial-team (at) simplywallst.com.
About SEHK:819
Tianneng Power International
An investment holding company, engages in the research, development, manufacture, and sale of power batteries for electric vehicle market in the People’s Republic of China and internationally.
Undervalued with adequate balance sheet.
Similar Companies
Market Insights
Community Narratives


