Performance Technologies' (ATH:PERF) 47% CAGR outpaced the company's earnings growth over the same five-year period


For many, the main point of investing in the stock market is to achieve spectacular returns. While not every stock performs well, when investors win, they can win big. For example, the Performance Technologies S.A. (ATH:PERF) share price is up a whopping 549% in the last half decade, a handsome return for long term holders. And this is just one example of the epic gains achieved by some long term investors. On top of that, the share price is up 18% in about a quarter. But this could be related to the strong market, which is up 7.7% in the last three months. Anyone who held for that rewarding ride would probably be keen to talk about it.
After a strong gain in the past week, it's worth seeing if longer term returns have been driven by improving fundamentals.
Check out our latest analysis for Performance Technologies
To paraphrase Benjamin Graham: Over the short term the market is a voting machine, but over the long term it's a weighing machine. One flawed but reasonable way to assess how sentiment around a company has changed is to compare the earnings per share (EPS) with the share price.
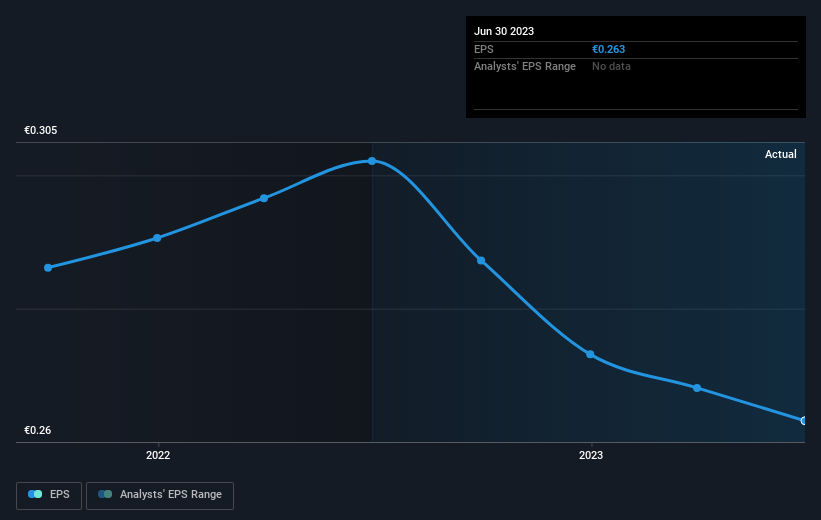
During five years of share price growth, Performance Technologies achieved compound earnings per share (EPS) growth of 24% per year. This EPS growth is lower than the 45% average annual increase in the share price. This suggests that market participants hold the company in higher regard, these days. And that's hardly shocking given the track record of growth.
The company's earnings per share (over time) is depicted in the image below (click to see the exact numbers).
Before buying or selling a stock, we always recommend a close examination of historic growth trends, available here.
What About Dividends?
When looking at investment returns, it is important to consider the difference between total shareholder return (TSR) and share price return. The TSR incorporates the value of any spin-offs or discounted capital raisings, along with any dividends, based on the assumption that the dividends are reinvested. Arguably, the TSR gives a more comprehensive picture of the return generated by a stock. We note that for Performance Technologies the TSR over the last 5 years was 585%, which is better than the share price return mentioned above. And there's no prize for guessing that the dividend payments largely explain the divergence!
A Different Perspective
Performance Technologies' TSR for the year was broadly in line with the market average, at 41%. It has to be noted that the recent return falls short of the 47% shareholders have gained each year, over half a decade. Although the share price growth has slowed, the longer term story points to a business well worth watching. It's always interesting to track share price performance over the longer term. But to understand Performance Technologies better, we need to consider many other factors. For instance, we've identified 3 warning signs for Performance Technologies (1 is significant) that you should be aware of.
For those who like to find winning investments this free list of growing companies with recent insider purchasing, could be just the ticket.
Please note, the market returns quoted in this article reflect the market weighted average returns of stocks that currently trade on Greek exchanges.
New: Manage All Your Stock Portfolios in One Place
We've created the ultimate portfolio companion for stock investors, and it's free.
• Connect an unlimited number of Portfolios and see your total in one currency
• Be alerted to new Warning Signs or Risks via email or mobile
• Track the Fair Value of your stocks
Have feedback on this article? Concerned about the content? Get in touch with us directly. Alternatively, email editorial-team (at) simplywallst.com.
This article by Simply Wall St is general in nature. We provide commentary based on historical data and analyst forecasts only using an unbiased methodology and our articles are not intended to be financial advice. It does not constitute a recommendation to buy or sell any stock, and does not take account of your objectives, or your financial situation. We aim to bring you long-term focused analysis driven by fundamental data. Note that our analysis may not factor in the latest price-sensitive company announcements or qualitative material. Simply Wall St has no position in any stocks mentioned.
About ATSE:PERF
Excellent balance sheet with questionable track record.
