

Key Insights
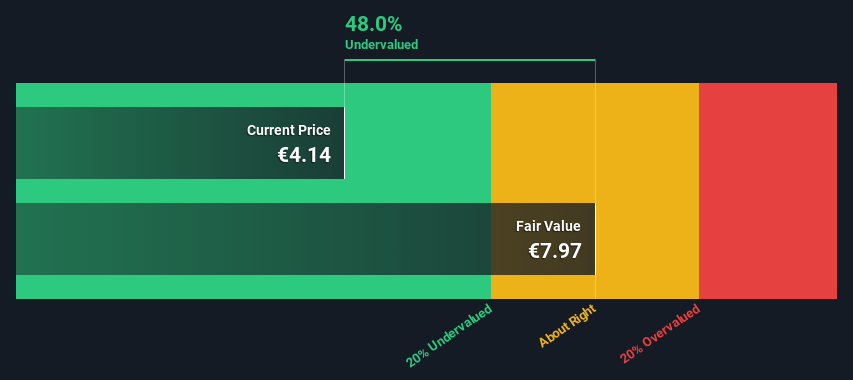
- Fourlis Holdings' estimated fair value is €7.97 based on 2 Stage Free Cash Flow to Equity
- Fourlis Holdings is estimated to be 48% undervalued based on current share price of €4.14
- Analyst price target for FOYRK is €5.04 which is 37% below our fair value estimate
Today we'll do a simple run through of a valuation method used to estimate the attractiveness of Fourlis Holdings S.A. (ATH:FOYRK) as an investment opportunity by taking the forecast future cash flows of the company and discounting them back to today's value. We will use the Discounted Cash Flow (DCF) model on this occasion. Models like these may appear beyond the comprehension of a lay person, but they're fairly easy to follow.
Companies can be valued in a lot of ways, so we would point out that a DCF is not perfect for every situation. If you still have some burning questions about this type of valuation, take a look at the Simply Wall St analysis model.
See our latest analysis for Fourlis Holdings
Is Fourlis Holdings Fairly Valued?
We are going to use a two-stage DCF model, which, as the name states, takes into account two stages of growth. The first stage is generally a higher growth period which levels off heading towards the terminal value, captured in the second 'steady growth' period. To start off with, we need to estimate the next ten years of cash flows. Where possible we use analyst estimates, but when these aren't available we extrapolate the previous free cash flow (FCF) from the last estimate or reported value. We assume companies with shrinking free cash flow will slow their rate of shrinkage, and that companies with growing free cash flow will see their growth rate slow, over this period. We do this to reflect that growth tends to slow more in the early years than it does in later years.
Generally we assume that a dollar today is more valuable than a dollar in the future, so we discount the value of these future cash flows to their estimated value in today's dollars:
10-year free cash flow (FCF) forecast
| 2024 | 2025 | 2026 | 2027 | 2028 | 2029 | 2030 | 2031 | 2032 | 2033 | |
| Levered FCF (€, Millions) | €23.4m | €30.6m | €50.3m | €66.5m | €81.9m | €95.8m | €107.9m | €118.2m | €127.1m | €134.6m |
| Growth Rate Estimate Source | Analyst x2 | Analyst x2 | Analyst x1 | Est @ 32.12% | Est @ 23.22% | Est @ 16.99% | Est @ 12.63% | Est @ 9.58% | Est @ 7.45% | Est @ 5.95% |
| Present Value (€, Millions) Discounted @ 20% | €19.5 | €21.3 | €29.2 | €32.2 | €33.1 | €32.3 | €30.3 | €27.7 | €24.8 | €21.9 |
("Est" = FCF growth rate estimated by Simply Wall St)
Present Value of 10-year Cash Flow (PVCF) = €272m
The second stage is also known as Terminal Value, this is the business's cash flow after the first stage. The Gordon Growth formula is used to calculate Terminal Value at a future annual growth rate equal to the 5-year average of the 10-year government bond yield of 2.5%. We discount the terminal cash flows to today's value at a cost of equity of 20%.
Terminal Value (TV)= FCF2033 × (1 + g) ÷ (r – g) = €135m× (1 + 2.5%) ÷ (20%– 2.5%) = €791m
Present Value of Terminal Value (PVTV)= TV / (1 + r)10= €791m÷ ( 1 + 20%)10= €129m
The total value is the sum of cash flows for the next ten years plus the discounted terminal value, which results in the Total Equity Value, which in this case is €401m. To get the intrinsic value per share, we divide this by the total number of shares outstanding. Compared to the current share price of €4.1, the company appears quite undervalued at a 48% discount to where the stock price trades currently. Valuations are imprecise instruments though, rather like a telescope - move a few degrees and end up in a different galaxy. Do keep this in mind.
The Assumptions
The calculation above is very dependent on two assumptions. The first is the discount rate and the other is the cash flows. Part of investing is coming up with your own evaluation of a company's future performance, so try the calculation yourself and check your own assumptions. The DCF also does not consider the possible cyclicality of an industry, or a company's future capital requirements, so it does not give a full picture of a company's potential performance. Given that we are looking at Fourlis Holdings as potential shareholders, the cost of equity is used as the discount rate, rather than the cost of capital (or weighted average cost of capital, WACC) which accounts for debt. In this calculation we've used 20%, which is based on a levered beta of 1.666. Beta is a measure of a stock's volatility, compared to the market as a whole. We get our beta from the industry average beta of globally comparable companies, with an imposed limit between 0.8 and 2.0, which is a reasonable range for a stable business.
SWOT Analysis for Fourlis Holdings
- Earnings growth over the past year exceeded the industry.
- Debt is well covered by cash flow.
- Interest payments on debt are not well covered.
- Dividend is low compared to the top 25% of dividend payers in the Specialty Retail market.
- Annual earnings are forecast to grow faster than the Greek market.
- Good value based on P/E ratio and estimated fair value.
- Paying a dividend but company has no free cash flows.
- Revenue is forecast to grow slower than 20% per year.
Looking Ahead:
Valuation is only one side of the coin in terms of building your investment thesis, and it ideally won't be the sole piece of analysis you scrutinize for a company. It's not possible to obtain a foolproof valuation with a DCF model. Preferably you'd apply different cases and assumptions and see how they would impact the company's valuation. For example, changes in the company's cost of equity or the risk free rate can significantly impact the valuation. Why is the intrinsic value higher than the current share price? For Fourlis Holdings, we've put together three pertinent aspects you should explore:
- Risks: Be aware that Fourlis Holdings is showing 3 warning signs in our investment analysis , and 1 of those is concerning...
- Future Earnings: How does FOYRK's growth rate compare to its peers and the wider market? Dig deeper into the analyst consensus number for the upcoming years by interacting with our free analyst growth expectation chart.
- Other High Quality Alternatives: Do you like a good all-rounder? Explore our interactive list of high quality stocks to get an idea of what else is out there you may be missing!
PS. Simply Wall St updates its DCF calculation for every Greek stock every day, so if you want to find the intrinsic value of any other stock just search here.
New: AI Stock Screener & Alerts
Our new AI Stock Screener scans the market every day to uncover opportunities.
• Dividend Powerhouses (3%+ Yield)
• Undervalued Small Caps with Insider Buying
• High growth Tech and AI Companies
Or build your own from over 50 metrics.
Have feedback on this article? Concerned about the content? Get in touch with us directly. Alternatively, email editorial-team (at) simplywallst.com.
This article by Simply Wall St is general in nature. We provide commentary based on historical data and analyst forecasts only using an unbiased methodology and our articles are not intended to be financial advice. It does not constitute a recommendation to buy or sell any stock, and does not take account of your objectives, or your financial situation. We aim to bring you long-term focused analysis driven by fundamental data. Note that our analysis may not factor in the latest price-sensitive company announcements or qualitative material. Simply Wall St has no position in any stocks mentioned.
About ATSE:FOYRK
Fourlis Holdings
Engages in the retail trading activities in Greece, Romania, Bulgaria, Cyprus, and Turkey.
Very undervalued with excellent balance sheet.
Market Insights

Community Narratives

