- Greece
- /
- Oil and Gas
- /
- ATSE:MOH
Motor Oil (Hellas) Corinth Refineries (ATH:MOH) Has A Somewhat Strained Balance Sheet

Legendary fund manager Li Lu (who Charlie Munger backed) once said, 'The biggest investment risk is not the volatility of prices, but whether you will suffer a permanent loss of capital.' So it might be obvious that you need to consider debt, when you think about how risky any given stock is, because too much debt can sink a company. As with many other companies Motor Oil (Hellas) Corinth Refineries S.A. (ATH:MOH) makes use of debt. But is this debt a concern to shareholders?
Why Does Debt Bring Risk?
Debt and other liabilities become risky for a business when it cannot easily fulfill those obligations, either with free cash flow or by raising capital at an attractive price. Part and parcel of capitalism is the process of 'creative destruction' where failed businesses are mercilessly liquidated by their bankers. However, a more frequent (but still costly) occurrence is where a company must issue shares at bargain-basement prices, permanently diluting shareholders, just to shore up its balance sheet. Of course, the upside of debt is that it often represents cheap capital, especially when it replaces dilution in a company with the ability to reinvest at high rates of return. The first thing to do when considering how much debt a business uses is to look at its cash and debt together.
View our latest analysis for Motor Oil (Hellas) Corinth Refineries
What Is Motor Oil (Hellas) Corinth Refineries's Debt?
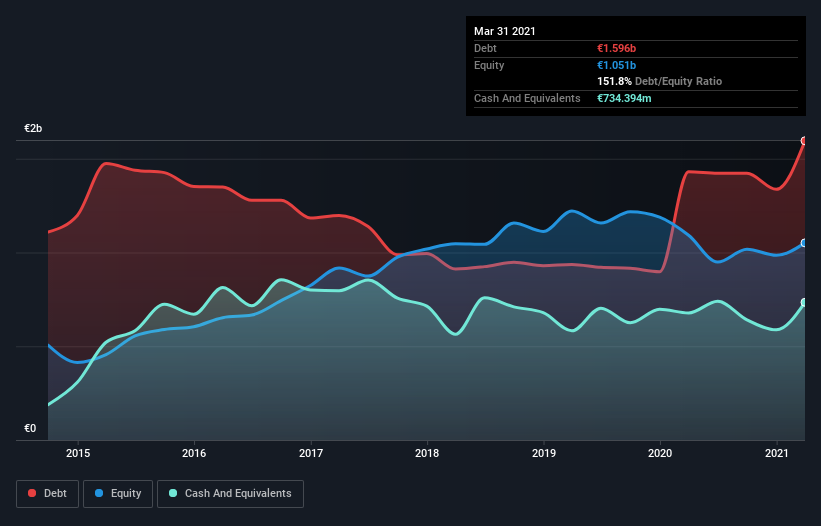
As you can see below, at the end of March 2021, Motor Oil (Hellas) Corinth Refineries had €1.60b of debt, up from €1.43b a year ago. Click the image for more detail. However, it also had €734.4m in cash, and so its net debt is €861.5m.
A Look At Motor Oil (Hellas) Corinth Refineries' Liabilities
According to the last reported balance sheet, Motor Oil (Hellas) Corinth Refineries had liabilities of €1.17b due within 12 months, and liabilities of €1.66b due beyond 12 months. On the other hand, it had cash of €734.4m and €522.4m worth of receivables due within a year. So its liabilities outweigh the sum of its cash and (near-term) receivables by €1.57b.
Given this deficit is actually higher than the company's market capitalization of €1.50b, we think shareholders really should watch Motor Oil (Hellas) Corinth Refineries's debt levels, like a parent watching their child ride a bike for the first time. Hypothetically, extremely heavy dilution would be required if the company were forced to pay down its liabilities by raising capital at the current share price.
We use two main ratios to inform us about debt levels relative to earnings. The first is net debt divided by earnings before interest, tax, depreciation, and amortization (EBITDA), while the second is how many times its earnings before interest and tax (EBIT) covers its interest expense (or its interest cover, for short). Thus we consider debt relative to earnings both with and without depreciation and amortization expenses.
Motor Oil (Hellas) Corinth Refineries's debt is 3.1 times its EBITDA, and its EBIT cover its interest expense 3.4 times over. This suggests that while the debt levels are significant, we'd stop short of calling them problematic. However, it should be some comfort for shareholders to recall that Motor Oil (Hellas) Corinth Refineries actually grew its EBIT by a hefty 110%, over the last 12 months. If it can keep walking that path it will be in a position to shed its debt with relative ease. When analysing debt levels, the balance sheet is the obvious place to start. But it is future earnings, more than anything, that will determine Motor Oil (Hellas) Corinth Refineries's ability to maintain a healthy balance sheet going forward. So if you're focused on the future you can check out this free report showing analyst profit forecasts.
But our final consideration is also important, because a company cannot pay debt with paper profits; it needs cold hard cash. So we always check how much of that EBIT is translated into free cash flow. In the last three years, Motor Oil (Hellas) Corinth Refineries created free cash flow amounting to 11% of its EBIT, an uninspiring performance. That limp level of cash conversion undermines its ability to manage and pay down debt.
Our View
To be frank both Motor Oil (Hellas) Corinth Refineries's conversion of EBIT to free cash flow and its track record of staying on top of its total liabilities make us rather uncomfortable with its debt levels. But on the bright side, its EBIT growth rate is a good sign, and makes us more optimistic. Once we consider all the factors above, together, it seems to us that Motor Oil (Hellas) Corinth Refineries's debt is making it a bit risky. Some people like that sort of risk, but we're mindful of the potential pitfalls, so we'd probably prefer it carry less debt. When analysing debt levels, the balance sheet is the obvious place to start. But ultimately, every company can contain risks that exist outside of the balance sheet. We've identified 1 warning sign with Motor Oil (Hellas) Corinth Refineries , and understanding them should be part of your investment process.
If you're interested in investing in businesses that can grow profits without the burden of debt, then check out this free list of growing businesses that have net cash on the balance sheet.
When trading stocks or any other investment, use the platform considered by many to be the Professional's Gateway to the Worlds Market, Interactive Brokers. You get the lowest-cost* trading on stocks, options, futures, forex, bonds and funds worldwide from a single integrated account. Promoted
New: Manage All Your Stock Portfolios in One Place
We've created the ultimate portfolio companion for stock investors, and it's free.
• Connect an unlimited number of Portfolios and see your total in one currency
• Be alerted to new Warning Signs or Risks via email or mobile
• Track the Fair Value of your stocks
This article by Simply Wall St is general in nature. It does not constitute a recommendation to buy or sell any stock, and does not take account of your objectives, or your financial situation. We aim to bring you long-term focused analysis driven by fundamental data. Note that our analysis may not factor in the latest price-sensitive company announcements or qualitative material. Simply Wall St has no position in any stocks mentioned.
*Interactive Brokers Rated Lowest Cost Broker by StockBrokers.com Annual Online Review 2020
Have feedback on this article? Concerned about the content? Get in touch with us directly. Alternatively, email editorial-team (at) simplywallst.com.
About ATSE:MOH
Motor Oil (Hellas) Corinth Refineries
Motor Oil (Hellas) Corinth Refineries S.A.
Undervalued average dividend payer.
Market Insights

Community Narratives

