
Advertisement
- Greece
- /
- Industrials
- /
- ATSE:MYTIL
Calculating The Intrinsic Value Of Metlen Energy & Metals S.A. (ATH:MYTIL)

Key Insights
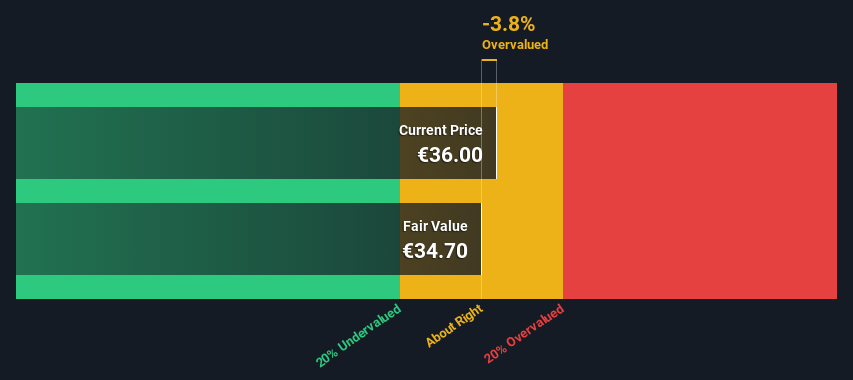
- The projected fair value for Metlen Energy & Metals is €34.70 based on 2 Stage Free Cash Flow to Equity
- Current share price of €36.00 suggests Metlen Energy & Metals is potentially trading close to its fair value
- Our fair value estimate is 26% lower than Metlen Energy & Metals' analyst price target of €46.73
Today we will run through one way of estimating the intrinsic value of Metlen Energy & Metals S.A. (ATH:MYTIL) by estimating the company's future cash flows and discounting them to their present value. This will be done using the Discounted Cash Flow (DCF) model. Don't get put off by the jargon, the math behind it is actually quite straightforward.
Companies can be valued in a lot of ways, so we would point out that a DCF is not perfect for every situation. For those who are keen learners of equity analysis, the Simply Wall St analysis model here may be something of interest to you.
See our latest analysis for Metlen Energy & Metals
Step By Step Through The Calculation
We are going to use a two-stage DCF model, which, as the name states, takes into account two stages of growth. The first stage is generally a higher growth period which levels off heading towards the terminal value, captured in the second 'steady growth' period. In the first stage we need to estimate the cash flows to the business over the next ten years. Where possible we use analyst estimates, but when these aren't available we extrapolate the previous free cash flow (FCF) from the last estimate or reported value. We assume companies with shrinking free cash flow will slow their rate of shrinkage, and that companies with growing free cash flow will see their growth rate slow, over this period. We do this to reflect that growth tends to slow more in the early years than it does in later years.
A DCF is all about the idea that a dollar in the future is less valuable than a dollar today, so we discount the value of these future cash flows to their estimated value in today's dollars:
10-year free cash flow (FCF) forecast
| 2025 | 2026 | 2027 | 2028 | 2029 | 2030 | 2031 | 2032 | 2033 | 2034 | |
| Levered FCF (€, Millions) | €256.9m | €265.0m | €400.3m | €455.8m | €497.1m | €532.2m | €562.4m | €588.8m | €612.4m | €634.0m |
| Growth Rate Estimate Source | Analyst x3 | Analyst x3 | Analyst x2 | Analyst x2 | Est @ 9.06% | Est @ 7.07% | Est @ 5.67% | Est @ 4.69% | Est @ 4.01% | Est @ 3.53% |
| Present Value (€, Millions) Discounted @ 12% | €230 | €212 | €287 | €292 | €285 | €273 | €258 | €242 | €225 | €208 |
("Est" = FCF growth rate estimated by Simply Wall St)
Present Value of 10-year Cash Flow (PVCF) = €2.5b
We now need to calculate the Terminal Value, which accounts for all the future cash flows after this ten year period. For a number of reasons a very conservative growth rate is used that cannot exceed that of a country's GDP growth. In this case we have used the 5-year average of the 10-year government bond yield (2.4%) to estimate future growth. In the same way as with the 10-year 'growth' period, we discount future cash flows to today's value, using a cost of equity of 12%.
Terminal Value (TV)= FCF2034 × (1 + g) ÷ (r – g) = €634m× (1 + 2.4%) ÷ (12%– 2.4%) = €6.9b
Present Value of Terminal Value (PVTV)= TV / (1 + r)10= €6.9b÷ ( 1 + 12%)10= €2.3b
The total value, or equity value, is then the sum of the present value of the future cash flows, which in this case is €4.8b. In the final step we divide the equity value by the number of shares outstanding. Compared to the current share price of €36.0, the company appears around fair value at the time of writing. The assumptions in any calculation have a big impact on the valuation, so it is better to view this as a rough estimate, not precise down to the last cent.
Important Assumptions
The calculation above is very dependent on two assumptions. The first is the discount rate and the other is the cash flows. If you don't agree with these result, have a go at the calculation yourself and play with the assumptions. The DCF also does not consider the possible cyclicality of an industry, or a company's future capital requirements, so it does not give a full picture of a company's potential performance. Given that we are looking at Metlen Energy & Metals as potential shareholders, the cost of equity is used as the discount rate, rather than the cost of capital (or weighted average cost of capital, WACC) which accounts for debt. In this calculation we've used 12%, which is based on a levered beta of 1.134. Beta is a measure of a stock's volatility, compared to the market as a whole. We get our beta from the industry average beta of globally comparable companies, with an imposed limit between 0.8 and 2.0, which is a reasonable range for a stable business.
SWOT Analysis for Metlen Energy & Metals
Strength
- Earnings growth over the past year exceeded the industry.
- Debt is well covered by earnings.
Weakness
- Earnings growth over the past year is below its 5-year average.
- Dividend is low compared to the top 25% of dividend payers in the Industrials market.
- Current share price is above our estimate of fair value.
Opportunity
- Annual earnings are forecast to grow faster than the Greek market.
Threat
- Debt is not well covered by operating cash flow.
- Paying a dividend but company has no free cash flows.
- Revenue is forecast to grow slower than 20% per year.
Moving On:
Valuation is only one side of the coin in terms of building your investment thesis, and it shouldn't be the only metric you look at when researching a company. DCF models are not the be-all and end-all of investment valuation. Instead the best use for a DCF model is to test certain assumptions and theories to see if they would lead to the company being undervalued or overvalued. For example, changes in the company's cost of equity or the risk free rate can significantly impact the valuation. For Metlen Energy & Metals, we've put together three pertinent factors you should further research:
- Risks: Every company has them, and we've spotted 4 warning signs for Metlen Energy & Metals (of which 2 are significant!) you should know about.
- Management:Have insiders been ramping up their shares to take advantage of the market's sentiment for MYTIL's future outlook? Check out our management and board analysis with insights on CEO compensation and governance factors.
- Other High Quality Alternatives: Do you like a good all-rounder? Explore our interactive list of high quality stocks to get an idea of what else is out there you may be missing!
PS. Simply Wall St updates its DCF calculation for every Greek stock every day, so if you want to find the intrinsic value of any other stock just search here.
New: Manage All Your Stock Portfolios in One Place
We've created the ultimate portfolio companion for stock investors, and it's free.
• Connect an unlimited number of Portfolios and see your total in one currency
• Be alerted to new Warning Signs or Risks via email or mobile
• Track the Fair Value of your stocks
Have feedback on this article? Concerned about the content? Get in touch with us directly. Alternatively, email editorial-team (at) simplywallst.com.
This article by Simply Wall St is general in nature. We provide commentary based on historical data and analyst forecasts only using an unbiased methodology and our articles are not intended to be financial advice. It does not constitute a recommendation to buy or sell any stock, and does not take account of your objectives, or your financial situation. We aim to bring you long-term focused analysis driven by fundamental data. Note that our analysis may not factor in the latest price-sensitive company announcements or qualitative material. Simply Wall St has no position in any stocks mentioned.
Have feedback on this article? Concerned about the content? Get in touch with us directly. Alternatively, email editorial-team@simplywallst.com
About ATSE:MYTIL
Metlen Energy & Metals
Operates in energy, metals, and infrastructure and concessions sectors in Greece, the European Union, and internationally.
Fair value with moderate growth potential.
Market Insights

Advertisement
Community Narratives
The Most Undervalued of the Magnificent 7
Fair Value US$237.43|37.8% undervalued
IN
Community Contributor
CSL is undervalued in High Tax Scenario
Fair Value AU$263.33|10.2% undervalued
RA
Community Contributor
PVA TePla's New Strategy Aims for 22% Revenue Growth in Semiconductor Recovery
Fair Value €19.19|22.0% undervalued
MI
Community Contributor