- Greece
- /
- Trade Distributors
- /
- ATSE:GEBKA
Returns Are Gaining Momentum At General Commercial & Industrial (ATH:GEBKA)


What trends should we look for it we want to identify stocks that can multiply in value over the long term? Typically, we'll want to notice a trend of growing return on capital employed (ROCE) and alongside that, an expanding base of capital employed. Basically this means that a company has profitable initiatives that it can continue to reinvest in, which is a trait of a compounding machine. Speaking of which, we noticed some great changes in General Commercial & Industrial's (ATH:GEBKA) returns on capital, so let's have a look.
Understanding Return On Capital Employed (ROCE)
Just to clarify if you're unsure, ROCE is a metric for evaluating how much pre-tax income (in percentage terms) a company earns on the capital invested in its business. The formula for this calculation on General Commercial & Industrial is:
Return on Capital Employed = Earnings Before Interest and Tax (EBIT) ÷ (Total Assets - Current Liabilities)
0.092 = €2.9m ÷ (€36m - €4.1m) (Based on the trailing twelve months to June 2024).
Thus, General Commercial & Industrial has an ROCE of 9.2%. In absolute terms, that's a low return but it's around the Trade Distributors industry average of 11%.
View our latest analysis for General Commercial & Industrial
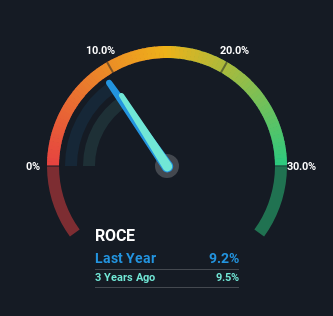
Historical performance is a great place to start when researching a stock so above you can see the gauge for General Commercial & Industrial's ROCE against it's prior returns. If you'd like to look at how General Commercial & Industrial has performed in the past in other metrics, you can view this free graph of General Commercial & Industrial's past earnings, revenue and cash flow .
How Are Returns Trending?
General Commercial & Industrial is showing promise given that its ROCE is trending up and to the right. The figures show that over the last five years, ROCE has grown 80% whilst employing roughly the same amount of capital. So our take on this is that the business has increased efficiencies to generate these higher returns, all the while not needing to make any additional investments. It's worth looking deeper into this though because while it's great that the business is more efficient, it might also mean that going forward the areas to invest internally for the organic growth are lacking.
In another part of our analysis, we noticed that the company's ratio of current liabilities to total assets decreased to 12%, which broadly means the business is relying less on its suppliers or short-term creditors to fund its operations. This tells us that General Commercial & Industrial has grown its returns without a reliance on increasing their current liabilities, which we're very happy with.
The Key Takeaway
To sum it up, General Commercial & Industrial is collecting higher returns from the same amount of capital, and that's impressive. And a remarkable 128% total return over the last five years tells us that investors are expecting more good things to come in the future. With that being said, we still think the promising fundamentals mean the company deserves some further due diligence.
If you want to continue researching General Commercial & Industrial, you might be interested to know about the 4 warning signs that our analysis has discovered.
If you want to search for solid companies with great earnings, check out this free list of companies with good balance sheets and impressive returns on equity.
If you're looking to trade General Commercial & Industrial, open an account with the lowest-cost platform trusted by professionals, Interactive Brokers.
With clients in over 200 countries and territories, and access to 160 markets, IBKR lets you trade stocks, options, futures, forex, bonds and funds from a single integrated account.
Enjoy no hidden fees, no account minimums, and FX conversion rates as low as 0.03%, far better than what most brokers offer.
Sponsored ContentNew: Manage All Your Stock Portfolios in One Place
We've created the ultimate portfolio companion for stock investors, and it's free.
• Connect an unlimited number of Portfolios and see your total in one currency
• Be alerted to new Warning Signs or Risks via email or mobile
• Track the Fair Value of your stocks
Have feedback on this article? Concerned about the content? Get in touch with us directly. Alternatively, email editorial-team (at) simplywallst.com.
This article by Simply Wall St is general in nature. We provide commentary based on historical data and analyst forecasts only using an unbiased methodology and our articles are not intended to be financial advice. It does not constitute a recommendation to buy or sell any stock, and does not take account of your objectives, or your financial situation. We aim to bring you long-term focused analysis driven by fundamental data. Note that our analysis may not factor in the latest price-sensitive company announcements or qualitative material. Simply Wall St has no position in any stocks mentioned.
About ATSE:GEBKA
General Commercial & Industrial
Supplies industrial and hydraulic equipment in Greece and East European countries.
Flawless balance sheet second-rate dividend payer.
Market Insights

Community Narratives

