- United Kingdom
- /
- Electric Utilities
- /
- LSE:SSE
SSE (LON:SSE) jumps 3.5% this week, though earnings growth is still tracking behind three-year shareholder returns


It might be of some concern to shareholders to see the SSE plc (LON:SSE) share price down 15% in the last month. But that shouldn't obscure the pleasing returns achieved by shareholders over the last three years. To wit, the share price did better than an index fund, climbing 12% during that period.
The past week has proven to be lucrative for SSE investors, so let's see if fundamentals drove the company's three-year performance.
Check out our latest analysis for SSE
To quote Buffett, 'Ships will sail around the world but the Flat Earth Society will flourish. There will continue to be wide discrepancies between price and value in the marketplace...' One way to examine how market sentiment has changed over time is to look at the interaction between a company's share price and its earnings per share (EPS).
SSE was able to grow its EPS at 24% per year over three years, sending the share price higher. The average annual share price increase of 4% is actually lower than the EPS growth. So it seems investors have become more cautious about the company, over time. This cautious sentiment is reflected in its (fairly low) P/E ratio of 6.23.
The company's earnings per share (over time) is depicted in the image below (click to see the exact numbers).
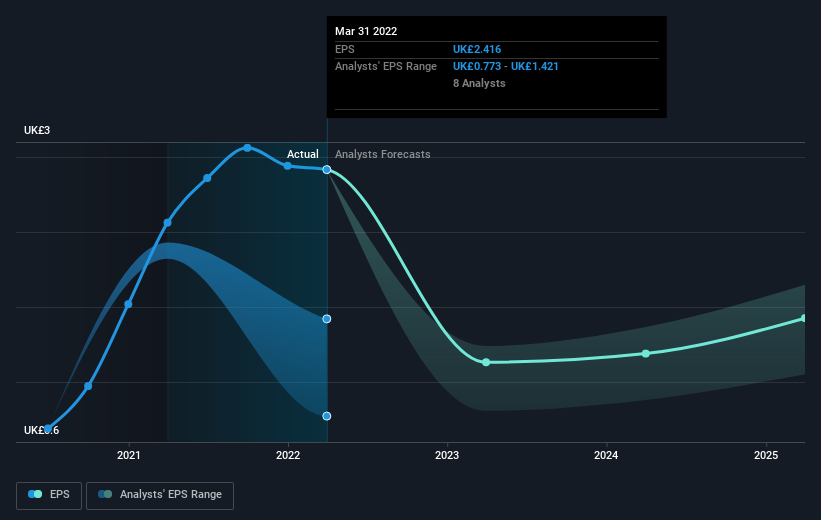
We know that SSE has improved its bottom line lately, but is it going to grow revenue? If you're interested, you could check this free report showing consensus revenue forecasts.
What About Dividends?
It is important to consider the total shareholder return, as well as the share price return, for any given stock. The TSR incorporates the value of any spin-offs or discounted capital raisings, along with any dividends, based on the assumption that the dividends are reinvested. It's fair to say that the TSR gives a more complete picture for stocks that pay a dividend. As it happens, SSE's TSR for the last 3 years was 31%, which exceeds the share price return mentioned earlier. And there's no prize for guessing that the dividend payments largely explain the divergence!
A Different Perspective
Although it hurts that SSE returned a loss of 4.1% in the last twelve months, the broader market was actually worse, returning a loss of 13%. Of course, the long term returns are far more important and the good news is that over five years, the stock has returned 9% for each year. It could be that the business is just facing some short term problems, but shareholders should keep a close eye on the fundamentals. It's always interesting to track share price performance over the longer term. But to understand SSE better, we need to consider many other factors. Case in point: We've spotted 3 warning signs for SSE you should be aware of, and 2 of them don't sit too well with us.
For those who like to find winning investments this free list of growing companies with recent insider purchasing, could be just the ticket.
Please note, the market returns quoted in this article reflect the market weighted average returns of stocks that currently trade on GB exchanges.
If you're looking to trade SSE, open an account with the lowest-cost platform trusted by professionals, Interactive Brokers.
With clients in over 200 countries and territories, and access to 160 markets, IBKR lets you trade stocks, options, futures, forex, bonds and funds from a single integrated account.
Enjoy no hidden fees, no account minimums, and FX conversion rates as low as 0.03%, far better than what most brokers offer.
Sponsored ContentNew: Manage All Your Stock Portfolios in One Place
We've created the ultimate portfolio companion for stock investors, and it's free.
• Connect an unlimited number of Portfolios and see your total in one currency
• Be alerted to new Warning Signs or Risks via email or mobile
• Track the Fair Value of your stocks
Have feedback on this article? Concerned about the content? Get in touch with us directly. Alternatively, email editorial-team (at) simplywallst.com.
This article by Simply Wall St is general in nature. We provide commentary based on historical data and analyst forecasts only using an unbiased methodology and our articles are not intended to be financial advice. It does not constitute a recommendation to buy or sell any stock, and does not take account of your objectives, or your financial situation. We aim to bring you long-term focused analysis driven by fundamental data. Note that our analysis may not factor in the latest price-sensitive company announcements or qualitative material. Simply Wall St has no position in any stocks mentioned.
About LSE:SSE
SSE
Engages in the generation, transmission, distribution, and supply of electricity.
Undervalued with proven track record.
Similar Companies
Market Insights

Community Narratives

