
Advertisement
- United Kingdom
- /
- Other Utilities
- /
- LSE:NG.
Here's Why National Grid (LON:NG.) Is Weighed Down By Its Debt Load

Howard Marks put it nicely when he said that, rather than worrying about share price volatility, 'The possibility of permanent loss is the risk I worry about... and every practical investor I know worries about.' It's only natural to consider a company's balance sheet when you examine how risky it is, since debt is often involved when a business collapses. We can see that National Grid plc (LON:NG.) does use debt in its business. But the more important question is: how much risk is that debt creating?
Why Does Debt Bring Risk?
Generally speaking, debt only becomes a real problem when a company can't easily pay it off, either by raising capital or with its own cash flow. In the worst case scenario, a company can go bankrupt if it cannot pay its creditors. However, a more frequent (but still costly) occurrence is where a company must issue shares at bargain-basement prices, permanently diluting shareholders, just to shore up its balance sheet. By replacing dilution, though, debt can be an extremely good tool for businesses that need capital to invest in growth at high rates of return. The first thing to do when considering how much debt a business uses is to look at its cash and debt together.
Check out our latest analysis for National Grid
How Much Debt Does National Grid Carry?
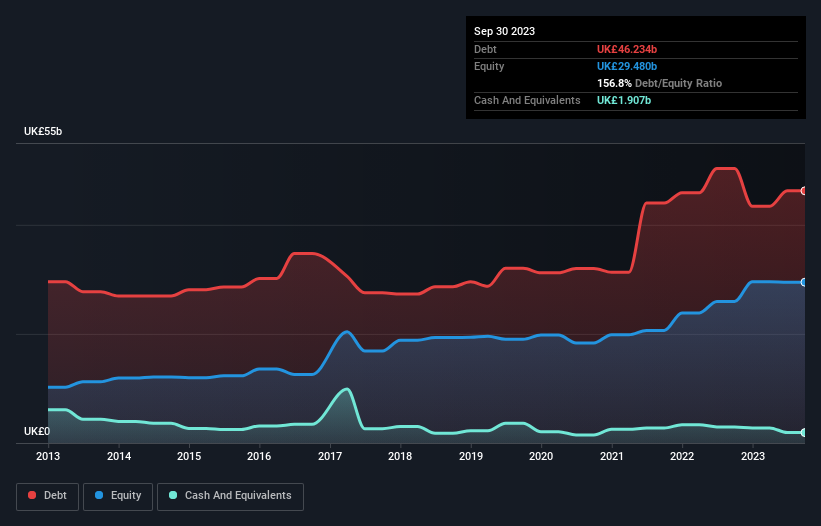
As you can see below, National Grid had UK£46.2b of debt at September 2023, down from UK£50.3b a year prior. However, it also had UK£1.91b in cash, and so its net debt is UK£44.3b.
A Look At National Grid's Liabilities
We can see from the most recent balance sheet that National Grid had liabilities of UK£8.28b falling due within a year, and liabilities of UK£56.5b due beyond that. Offsetting this, it had UK£1.91b in cash and UK£3.36b in receivables that were due within 12 months. So its liabilities total UK£59.5b more than the combination of its cash and short-term receivables.
The deficiency here weighs heavily on the UK£38.1b company itself, as if a child were struggling under the weight of an enormous back-pack full of books, his sports gear, and a trumpet. So we definitely think shareholders need to watch this one closely. After all, National Grid would likely require a major re-capitalisation if it had to pay its creditors today.
We use two main ratios to inform us about debt levels relative to earnings. The first is net debt divided by earnings before interest, tax, depreciation, and amortization (EBITDA), while the second is how many times its earnings before interest and tax (EBIT) covers its interest expense (or its interest cover, for short). Thus we consider debt relative to earnings both with and without depreciation and amortization expenses.
National Grid has a rather high debt to EBITDA ratio of 7.6 which suggests a meaningful debt load. However, its interest coverage of 2.8 is reasonably strong, which is a good sign. Another concern for investors might be that National Grid's EBIT fell 13% in the last year. If that's the way things keep going handling the debt load will be like delivering hot coffees on a pogo stick. When analysing debt levels, the balance sheet is the obvious place to start. But ultimately the future profitability of the business will decide if National Grid can strengthen its balance sheet over time. So if you're focused on the future you can check out this free report showing analyst profit forecasts.
Finally, a business needs free cash flow to pay off debt; accounting profits just don't cut it. So we always check how much of that EBIT is translated into free cash flow. Over the last three years, National Grid reported free cash flow worth 3.6% of its EBIT, which is really quite low. For us, cash conversion that low sparks a little paranoia about is ability to extinguish debt.
Our View
To be frank both National Grid's level of total liabilities and its track record of managing its debt, based on its EBITDA, make us rather uncomfortable with its debt levels. And even its EBIT growth rate fails to inspire much confidence. It's also worth noting that National Grid is in the Integrated Utilities industry, which is often considered to be quite defensive. Taking into account all the aforementioned factors, it looks like National Grid has too much debt. That sort of riskiness is ok for some, but it certainly doesn't float our boat. When analysing debt levels, the balance sheet is the obvious place to start. However, not all investment risk resides within the balance sheet - far from it. We've identified 2 warning signs with National Grid (at least 1 which doesn't sit too well with us) , and understanding them should be part of your investment process.
If you're interested in investing in businesses that can grow profits without the burden of debt, then check out this free list of growing businesses that have net cash on the balance sheet.
Valuation is complex, but we're here to simplify it.
Discover if National Grid might be undervalued or overvalued with our detailed analysis, featuring fair value estimates, potential risks, dividends, insider trades, and its financial condition.
Access Free AnalysisHave feedback on this article? Concerned about the content? Get in touch with us directly. Alternatively, email editorial-team (at) simplywallst.com.
This article by Simply Wall St is general in nature. We provide commentary based on historical data and analyst forecasts only using an unbiased methodology and our articles are not intended to be financial advice. It does not constitute a recommendation to buy or sell any stock, and does not take account of your objectives, or your financial situation. We aim to bring you long-term focused analysis driven by fundamental data. Note that our analysis may not factor in the latest price-sensitive company announcements or qualitative material. Simply Wall St has no position in any stocks mentioned.
About LSE:NG.
National Grid
National Grid plc transmits and distributes electricity and gas.
Slight with moderate growth potential.
Similar Companies
Market Insights


Advertisement
Community Narratives
Nike's Direct-to-Consumer Focus Will Drive Future Growth
Fair Value US$87.90|18.2% undervalued
UN
Community Contributor
Novo Nordisk will dominate GLP-1 market with Ozempic and Wegovy growth
Fair Value US$89.59|12.1% undervalued
BE
Community Contributor
Rheinmetall could get 20-25% of EU-NATO 3%-GDP defence spending
Fair Value €7.57k|82.4% undervalued
NO
Community Contributor