- United Kingdom
- /
- Other Utilities
- /
- LSE:CNA
Centrica's (LON:CNA) investors will be pleased with their stellar 155% return over the last three years

It might seem bad, but the worst that can happen when you buy a stock (without leverage) is that its share price goes to zero. But if you buy shares in a really great company, you can more than double your money. For example, the Centrica plc (LON:CNA) share price has soared 141% in the last three years. How nice for those who held the stock!
So let's assess the underlying fundamentals over the last 3 years and see if they've moved in lock-step with shareholder returns.
View our latest analysis for Centrica
There is no denying that markets are sometimes efficient, but prices do not always reflect underlying business performance. One imperfect but simple way to consider how the market perception of a company has shifted is to compare the change in the earnings per share (EPS) with the share price movement.
Centrica was able to grow its EPS at 15% per year over three years, sending the share price higher. In comparison, the 34% per year gain in the share price outpaces the EPS growth. This indicates that the market is feeling more optimistic on the stock, after the last few years of progress. It's not unusual to see the market 're-rate' a stock, after a few years of growth.
You can see below how EPS has changed over time (discover the exact values by clicking on the image).
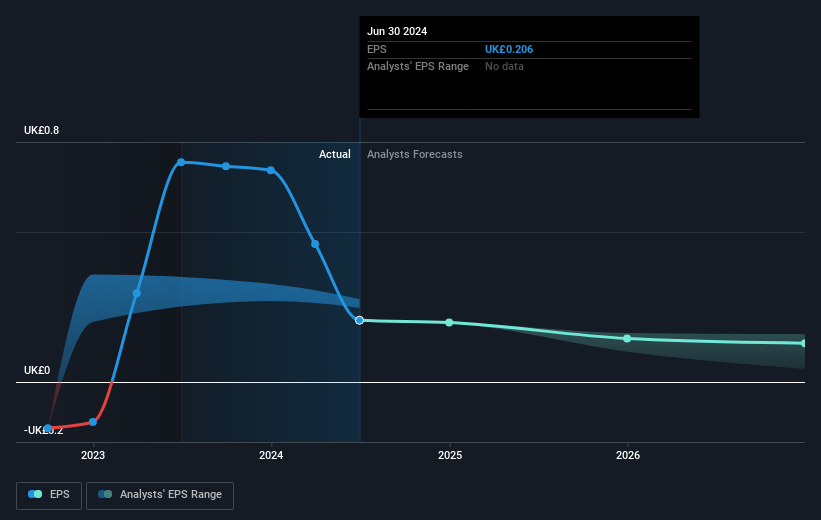
It's good to see that there was some significant insider buying in the last three months. That's a positive. On the other hand, we think the revenue and earnings trends are much more meaningful measures of the business. Before buying or selling a stock, we always recommend a close examination of historic growth trends, available here..
What About Dividends?
When looking at investment returns, it is important to consider the difference between total shareholder return (TSR) and share price return. The TSR incorporates the value of any spin-offs or discounted capital raisings, along with any dividends, based on the assumption that the dividends are reinvested. So for companies that pay a generous dividend, the TSR is often a lot higher than the share price return. In the case of Centrica, it has a TSR of 155% for the last 3 years. That exceeds its share price return that we previously mentioned. And there's no prize for guessing that the dividend payments largely explain the divergence!
A Different Perspective
Centrica shareholders are down 14% for the year (even including dividends), but the market itself is up 15%. Even the share prices of good stocks drop sometimes, but we want to see improvements in the fundamental metrics of a business, before getting too interested. Longer term investors wouldn't be so upset, since they would have made 16%, each year, over five years. It could be that the recent sell-off is an opportunity, so it may be worth checking the fundamental data for signs of a long term growth trend. I find it very interesting to look at share price over the long term as a proxy for business performance. But to truly gain insight, we need to consider other information, too. Case in point: We've spotted 4 warning signs for Centrica you should be aware of, and 2 of them are concerning.
Centrica is not the only stock that insiders are buying. For those who like to find lesser know companies this free list of growing companies with recent insider purchasing, could be just the ticket.
Please note, the market returns quoted in this article reflect the market weighted average returns of stocks that currently trade on British exchanges.
New: AI Stock Screener & Alerts
Our new AI Stock Screener scans the market every day to uncover opportunities.
• Dividend Powerhouses (3%+ Yield)
• Undervalued Small Caps with Insider Buying
• High growth Tech and AI Companies
Or build your own from over 50 metrics.
Have feedback on this article? Concerned about the content? Get in touch with us directly. Alternatively, email editorial-team (at) simplywallst.com.
This article by Simply Wall St is general in nature. We provide commentary based on historical data and analyst forecasts only using an unbiased methodology and our articles are not intended to be financial advice. It does not constitute a recommendation to buy or sell any stock, and does not take account of your objectives, or your financial situation. We aim to bring you long-term focused analysis driven by fundamental data. Note that our analysis may not factor in the latest price-sensitive company announcements or qualitative material. Simply Wall St has no position in any stocks mentioned.
About LSE:CNA
Centrica
Operates as an integrated energy company in the United Kingdom, Ireland, Scandinavia, North America, and internationally.
Very undervalued with excellent balance sheet.

