
Advertisement
Does Halma (LON:HLMA) Have A Healthy Balance Sheet?

Some say volatility, rather than debt, is the best way to think about risk as an investor, but Warren Buffett famously said that 'Volatility is far from synonymous with risk.' It's only natural to consider a company's balance sheet when you examine how risky it is, since debt is often involved when a business collapses. As with many other companies Halma plc (LON:HLMA) makes use of debt. But the more important question is: how much risk is that debt creating?
Why Does Debt Bring Risk?
Debt and other liabilities become risky for a business when it cannot easily fulfill those obligations, either with free cash flow or by raising capital at an attractive price. Part and parcel of capitalism is the process of 'creative destruction' where failed businesses are mercilessly liquidated by their bankers. However, a more frequent (but still costly) occurrence is where a company must issue shares at bargain-basement prices, permanently diluting shareholders, just to shore up its balance sheet. Having said that, the most common situation is where a company manages its debt reasonably well - and to its own advantage. The first thing to do when considering how much debt a business uses is to look at its cash and debt together.
Check out our latest analysis for Halma
What Is Halma's Debt?
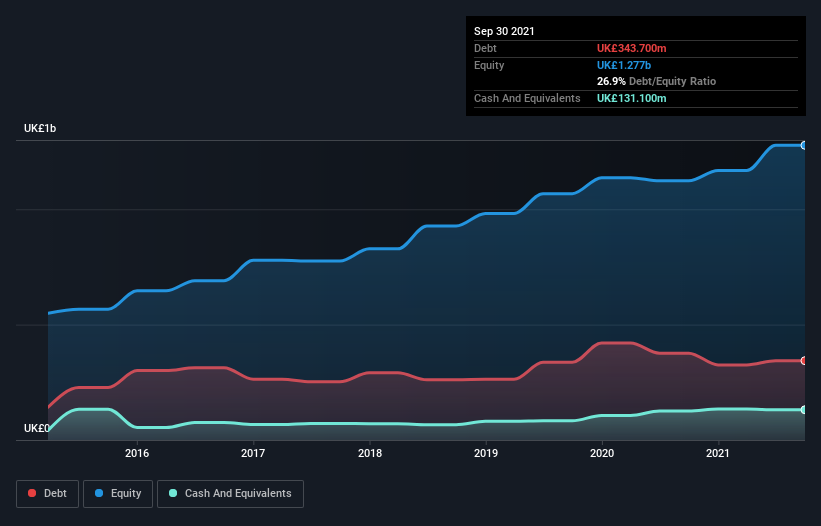
The image below, which you can click on for greater detail, shows that Halma had debt of UK£343.7m at the end of September 2021, a reduction from UK£376.1m over a year. However, because it has a cash reserve of UK£131.1m, its net debt is less, at about UK£212.6m.
How Strong Is Halma's Balance Sheet?
Zooming in on the latest balance sheet data, we can see that Halma had liabilities of UK£259.3m due within 12 months and liabilities of UK£476.8m due beyond that. Offsetting this, it had UK£131.1m in cash and UK£283.6m in receivables that were due within 12 months. So it has liabilities totalling UK£321.4m more than its cash and near-term receivables, combined.
Given Halma has a humongous market capitalization of UK£9.35b, it's hard to believe these liabilities pose much threat. Having said that, it's clear that we should continue to monitor its balance sheet, lest it change for the worse.
We use two main ratios to inform us about debt levels relative to earnings. The first is net debt divided by earnings before interest, tax, depreciation, and amortization (EBITDA), while the second is how many times its earnings before interest and tax (EBIT) covers its interest expense (or its interest cover, for short). Thus we consider debt relative to earnings both with and without depreciation and amortization expenses.
Halma has a low net debt to EBITDA ratio of only 0.62. And its EBIT covers its interest expense a whopping 34.3 times over. So you could argue it is no more threatened by its debt than an elephant is by a mouse. Also positive, Halma grew its EBIT by 21% in the last year, and that should make it easier to pay down debt, going forward. When analysing debt levels, the balance sheet is the obvious place to start. But it is future earnings, more than anything, that will determine Halma's ability to maintain a healthy balance sheet going forward. So if you're focused on the future you can check out this free report showing analyst profit forecasts.
But our final consideration is also important, because a company cannot pay debt with paper profits; it needs cold hard cash. So it's worth checking how much of that EBIT is backed by free cash flow. Over the last three years, Halma recorded free cash flow worth a fulsome 85% of its EBIT, which is stronger than we'd usually expect. That positions it well to pay down debt if desirable to do so.
Our View
Happily, Halma's impressive interest cover implies it has the upper hand on its debt. And the good news does not stop there, as its conversion of EBIT to free cash flow also supports that impression! Considering this range of factors, it seems to us that Halma is quite prudent with its debt, and the risks seem well managed. So the balance sheet looks pretty healthy, to us. There's no doubt that we learn most about debt from the balance sheet. However, not all investment risk resides within the balance sheet - far from it. For example - Halma has 2 warning signs we think you should be aware of.
If you're interested in investing in businesses that can grow profits without the burden of debt, then check out this free list of growing businesses that have net cash on the balance sheet.
Valuation is complex, but we're here to simplify it.
Discover if Halma might be undervalued or overvalued with our detailed analysis, featuring fair value estimates, potential risks, dividends, insider trades, and its financial condition.
Access Free AnalysisHave feedback on this article? Concerned about the content? Get in touch with us directly. Alternatively, email editorial-team (at) simplywallst.com.
This article by Simply Wall St is general in nature. We provide commentary based on historical data and analyst forecasts only using an unbiased methodology and our articles are not intended to be financial advice. It does not constitute a recommendation to buy or sell any stock, and does not take account of your objectives, or your financial situation. We aim to bring you long-term focused analysis driven by fundamental data. Note that our analysis may not factor in the latest price-sensitive company announcements or qualitative material. Simply Wall St has no position in any stocks mentioned.
About LSE:HLMA
Halma
Provides technology solutions in the safety, health, and environmental markets in the United States, Mainland Europe, the United Kingdom, the Asia Pacific, Africa, the Middle East, and internationally.
Excellent balance sheet with acceptable track record.
Similar Companies
Market Insights


Advertisement
Community Narratives
Pole position to benefit from GENIUS Act
Fair Value US$233.04|58.8% undervalued
CH
Community Contributor
IREN will transform from bitcoin miner to leader in AI infrastructure
Fair Value US$21.48|17.5% undervalued
KA
Community Contributor
Behind the Assay: XRF Scientific’s Role in Modern Mining Economics
Fair Value AU$2.10|2.4% undervalued
RO
Community Contributor