- United Kingdom
- /
- Software
- /
- LSE:SGE
Investors Could Be Concerned With Sage Group's (LON:SGE) Returns On Capital


To avoid investing in a business that's in decline, there's a few financial metrics that can provide early indications of aging. Typically, we'll see the trend of both return on capital employed (ROCE) declining and this usually coincides with a decreasing amount of capital employed. This indicates to us that the business is not only shrinking the size of its net assets, but its returns are falling as well. So after glancing at the trends within Sage Group (LON:SGE), we weren't too hopeful.
Understanding Return On Capital Employed (ROCE)
If you haven't worked with ROCE before, it measures the 'return' (pre-tax profit) a company generates from capital employed in its business. The formula for this calculation on Sage Group is:
Return on Capital Employed = Earnings Before Interest and Tax (EBIT) ÷ (Total Assets - Current Liabilities)
0.15 = UK£424m ÷ (UK£3.9b - UK£1.2b) (Based on the trailing twelve months to September 2023).
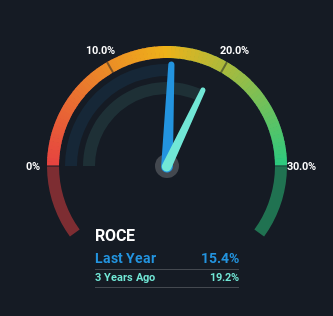
Therefore, Sage Group has an ROCE of 15%. In absolute terms, that's a satisfactory return, but compared to the Software industry average of 9.5% it's much better.
See our latest analysis for Sage Group
In the above chart we have measured Sage Group's prior ROCE against its prior performance, but the future is arguably more important. If you'd like to see what analysts are forecasting going forward, you should check out our free report for Sage Group.
What Can We Tell From Sage Group's ROCE Trend?
In terms of Sage Group's historical ROCE movements, the trend doesn't inspire confidence. To be more specific, the ROCE was 20% five years ago, but since then it has dropped noticeably. And on the capital employed front, the business is utilizing roughly the same amount of capital as it was back then. Companies that exhibit these attributes tend to not be shrinking, but they can be mature and facing pressure on their margins from competition. If these trends continue, we wouldn't expect Sage Group to turn into a multi-bagger.
Our Take On Sage Group's ROCE
All in all, the lower returns from the same amount of capital employed aren't exactly signs of a compounding machine. Yet despite these poor fundamentals, the stock has gained a huge 101% over the last five years, so investors appear very optimistic. In any case, the current underlying trends don't bode well for long term performance so unless they reverse, we'd start looking elsewhere.
If you'd like to know about the risks facing Sage Group, we've discovered 2 warning signs that you should be aware of.
While Sage Group may not currently earn the highest returns, we've compiled a list of companies that currently earn more than 25% return on equity. Check out this free list here.
New: Manage All Your Stock Portfolios in One Place
We've created the ultimate portfolio companion for stock investors, and it's free.
• Connect an unlimited number of Portfolios and see your total in one currency
• Be alerted to new Warning Signs or Risks via email or mobile
• Track the Fair Value of your stocks
Have feedback on this article? Concerned about the content? Get in touch with us directly. Alternatively, email editorial-team (at) simplywallst.com.
This article by Simply Wall St is general in nature. We provide commentary based on historical data and analyst forecasts only using an unbiased methodology and our articles are not intended to be financial advice. It does not constitute a recommendation to buy or sell any stock, and does not take account of your objectives, or your financial situation. We aim to bring you long-term focused analysis driven by fundamental data. Note that our analysis may not factor in the latest price-sensitive company announcements or qualitative material. Simply Wall St has no position in any stocks mentioned.
About LSE:SGE
Sage Group
Provides technology solutions and services for small and medium businesses in North America, Europe, the United Kingdom, Ireland, Africa and Asia-Pacific.
Proven track record average dividend payer.
