
Advertisement
- United Kingdom
- /
- Software
- /
- AIM:OMG
Oxford Metrics plc's (LON:OMG) Financial Prospects Don't Look Very Positive: Could It Mean A Stock Price Drop In The Future?

Oxford Metrics' (LON:OMG) stock up by 5.6% over the past three months. However, in this article, we decided to focus on its weak financials, as long-term fundamentals ultimately dictate market outcomes. Particularly, we will be paying attention to Oxford Metrics' ROE today.
Return on equity or ROE is a key measure used to assess how efficiently a company's management is utilizing the company's capital. In short, ROE shows the profit each dollar generates with respect to its shareholder investments.
View our latest analysis for Oxford Metrics
How Do You Calculate Return On Equity?
Return on equity can be calculated by using the formula:
Return on Equity = Net Profit (from continuing operations) ÷ Shareholders' Equity
So, based on the above formula, the ROE for Oxford Metrics is:
5.2% = UK£1.6m ÷ UK£31m (Based on the trailing twelve months to September 2020).
The 'return' refers to a company's earnings over the last year. One way to conceptualize this is that for each £1 of shareholders' capital it has, the company made £0.05 in profit.
Why Is ROE Important For Earnings Growth?
We have already established that ROE serves as an efficient profit-generating gauge for a company's future earnings. Depending on how much of these profits the company reinvests or "retains", and how effectively it does so, we are then able to assess a company’s earnings growth potential. Assuming everything else remains unchanged, the higher the ROE and profit retention, the higher the growth rate of a company compared to companies that don't necessarily bear these characteristics.
Oxford Metrics' Earnings Growth And 5.2% ROE
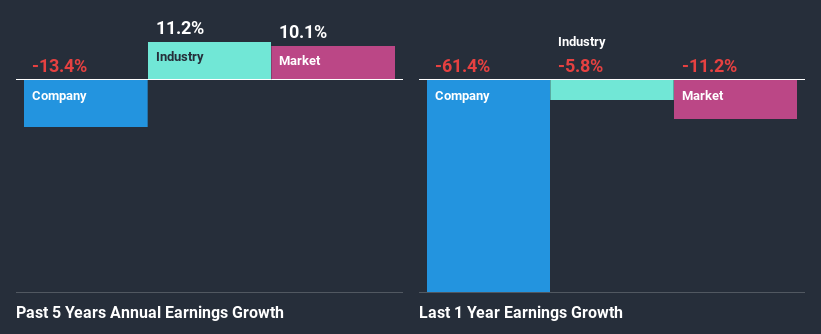
At first glance, Oxford Metrics' ROE doesn't look very promising. A quick further study shows that the company's ROE doesn't compare favorably to the industry average of 8.5% either. For this reason, Oxford Metrics' five year net income decline of 13% is not surprising given its lower ROE. However, there could also be other factors causing the earnings to decline. Such as - low earnings retention or poor allocation of capital.
So, as a next step, we compared Oxford Metrics' performance against the industry and were disappointed to discover that while the company has been shrinking its earnings, the industry has been growing its earnings at a rate of 11% in the same period.
The basis for attaching value to a company is, to a great extent, tied to its earnings growth. What investors need to determine next is if the expected earnings growth, or the lack of it, is already built into the share price. This then helps them determine if the stock is placed for a bright or bleak future. One good indicator of expected earnings growth is the P/E ratio which determines the price the market is willing to pay for a stock based on its earnings prospects. So, you may want to check if Oxford Metrics is trading on a high P/E or a low P/E, relative to its industry.
Is Oxford Metrics Making Efficient Use Of Its Profits?
Oxford Metrics has a high three-year median payout ratio of 54% (that is, it is retaining 46% of its profits). This suggests that the company is paying most of its profits as dividends to its shareholders. This goes some way in explaining why its earnings have been shrinking. With only a little being reinvested into the business, earnings growth would obviously be low or non-existent. Our risks dashboard should have the 3 risks we have identified for Oxford Metrics.
Additionally, Oxford Metrics has paid dividends over a period of at least ten years, which means that the company's management is determined to pay dividends even if it means little to no earnings growth. Upon studying the latest analysts' consensus data, we found that the company's future payout ratio is expected to rise to 65% over the next three years.
Summary
On the whole, Oxford Metrics' performance is quite a big let-down. Because the company is not reinvesting much into the business, and given the low ROE, it's not surprising to see the lack or absence of growth in its earnings. Until now, we have only just grazed the surface of the company's past performance by looking at the company's fundamentals. You can do your own research on Oxford Metrics and see how it has performed in the past by looking at this FREE detailed graph of past earnings, revenue and cash flows.
If you’re looking to trade Oxford Metrics, open an account with the lowest-cost* platform trusted by professionals, Interactive Brokers. Their clients from over 200 countries and territories trade stocks, options, futures, forex, bonds and funds worldwide from a single integrated account. Promoted
New: AI Stock Screener & Alerts
Our new AI Stock Screener scans the market every day to uncover opportunities.
• Dividend Powerhouses (3%+ Yield)
• Undervalued Small Caps with Insider Buying
• High growth Tech and AI Companies
Or build your own from over 50 metrics.
This article by Simply Wall St is general in nature. It does not constitute a recommendation to buy or sell any stock, and does not take account of your objectives, or your financial situation. We aim to bring you long-term focused analysis driven by fundamental data. Note that our analysis may not factor in the latest price-sensitive company announcements or qualitative material. Simply Wall St has no position in any stocks mentioned.
*Interactive Brokers Rated Lowest Cost Broker by StockBrokers.com Annual Online Review 2020
Have feedback on this article? Concerned about the content? Get in touch with us directly. Alternatively, email editorial-team (at) simplywallst.com.
About AIM:OMG
Oxford Metrics
Operates as a smart sensing and software company in the United Kingdom.
Flawless balance sheet average dividend payer.
Market Insights


Advertisement
Community Narratives
The Future of Drug Testing? Fingerprint Tech Shows Serious Promise
Fair Value US$2.98|40.3% undervalued
JO
Community Contributor
Suncorp’s Next Chapter: Insurance-Only and Ready to Grow
Fair Value AU$22.83|7.9% undervalued
RO
Community Contributor
Thyssenkrupp Nucera Will Achieve Double-Digit Profits by 2030 Boosted by Hydrogen Growth
Fair Value €14.40|31.3% undervalued
CH
Community Contributor
Tesla’s Nvidia Moment – The AI & Robotics Inflection Point
Fair Value US$359.72|12.3% undervalued
BL
Community Contributor