
Advertisement
- United Kingdom
- /
- Software
- /
- AIM:OMG
Oxford Metrics plc (LON:OMG) Stock's Been Sliding But Fundamentals Look Decent: Will The Market Correct The Share Price In The Future?

Oxford Metrics (LON:OMG) has had a rough three months with its share price down 17%. However, stock prices are usually driven by a company’s financials over the long term, which in this case look pretty respectable. Specifically, we decided to study Oxford Metrics' ROE in this article.
Return on equity or ROE is a key measure used to assess how efficiently a company's management is utilizing the company's capital. In short, ROE shows the profit each dollar generates with respect to its shareholder investments.
View our latest analysis for Oxford Metrics
How To Calculate Return On Equity?
The formula for ROE is:
Return on Equity = Net Profit (from continuing operations) ÷ Shareholders' Equity
So, based on the above formula, the ROE for Oxford Metrics is:
3.7% = UK£2.9m ÷ UK£79m (Based on the trailing twelve months to September 2024).
The 'return' is the income the business earned over the last year. That means that for every £1 worth of shareholders' equity, the company generated £0.04 in profit.
What Has ROE Got To Do With Earnings Growth?
Thus far, we have learned that ROE measures how efficiently a company is generating its profits. Based on how much of its profits the company chooses to reinvest or "retain", we are then able to evaluate a company's future ability to generate profits. Assuming everything else remains unchanged, the higher the ROE and profit retention, the higher the growth rate of a company compared to companies that don't necessarily bear these characteristics.
Oxford Metrics' Earnings Growth And 3.7% ROE
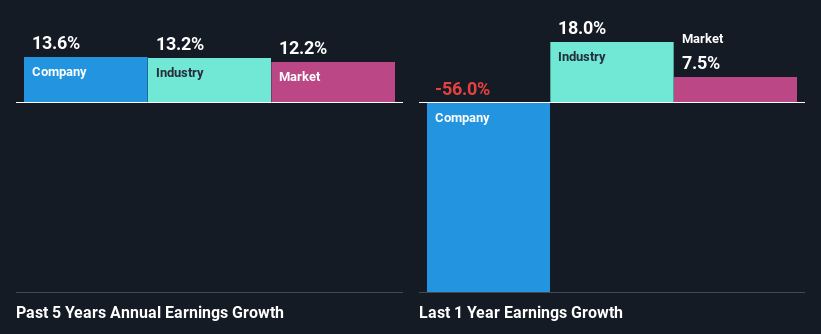
It is hard to argue that Oxford Metrics' ROE is much good in and of itself. Not just that, even compared to the industry average of 9.3%, the company's ROE is entirely unremarkable. Although, we can see that Oxford Metrics saw a modest net income growth of 14% over the past five years. We reckon that there could be other factors at play here. Such as - high earnings retention or an efficient management in place.
As a next step, we compared Oxford Metrics' net income growth with the industry and found that the company has a similar growth figure when compared with the industry average growth rate of 13% in the same period.
The basis for attaching value to a company is, to a great extent, tied to its earnings growth. The investor should try to establish if the expected growth or decline in earnings, whichever the case may be, is priced in. By doing so, they will have an idea if the stock is headed into clear blue waters or if swampy waters await. Has the market priced in the future outlook for OMG? You can find out in our latest intrinsic value infographic research report.
Is Oxford Metrics Efficiently Re-investing Its Profits?
The high three-year median payout ratio of 81% (or a retention ratio of 19%) for Oxford Metrics suggests that the company's growth wasn't really hampered despite it returning most of its income to its shareholders.
Additionally, Oxford Metrics has paid dividends over a period of at least ten years which means that the company is pretty serious about sharing its profits with shareholders. Looking at the current analyst consensus data, we can see that the company's future payout ratio is expected to rise to 112% over the next three years. Regardless, the future ROE for Oxford Metrics is speculated to rise to 5.0% despite the anticipated increase in the payout ratio. There could probably be other factors that could be driving the future growth in the ROE.
Conclusion
On the whole, we do feel that Oxford Metrics has some positive attributes. That is, quite an impressive growth in earnings. However, the low profit retention means that the company's earnings growth could have been higher, had it been reinvesting a higher portion of its profits. Having said that, the company's earnings growth is expected to slow down, as forecasted in the current analyst estimates. Are these analysts expectations based on the broad expectations for the industry, or on the company's fundamentals? Click here to be taken to our analyst's forecasts page for the company.
New: AI Stock Screener & Alerts
Our new AI Stock Screener scans the market every day to uncover opportunities.
• Dividend Powerhouses (3%+ Yield)
• Undervalued Small Caps with Insider Buying
• High growth Tech and AI Companies
Or build your own from over 50 metrics.
Have feedback on this article? Concerned about the content? Get in touch with us directly. Alternatively, email editorial-team (at) simplywallst.com.
This article by Simply Wall St is general in nature. We provide commentary based on historical data and analyst forecasts only using an unbiased methodology and our articles are not intended to be financial advice. It does not constitute a recommendation to buy or sell any stock, and does not take account of your objectives, or your financial situation. We aim to bring you long-term focused analysis driven by fundamental data. Note that our analysis may not factor in the latest price-sensitive company announcements or qualitative material. Simply Wall St has no position in any stocks mentioned.
About AIM:OMG
Oxford Metrics
Operates as a smart sensing and software company in the United Kingdom.
Flawless balance sheet average dividend payer.
Market Insights


Advertisement
Community Narratives
The Future of Drug Testing? Fingerprint Tech Shows Serious Promise
Fair Value US$2.98|40.3% undervalued
JO
Community Contributor
Suncorp’s Next Chapter: Insurance-Only and Ready to Grow
Fair Value AU$22.83|7.9% undervalued
RO
Community Contributor
Thyssenkrupp Nucera Will Achieve Double-Digit Profits by 2030 Boosted by Hydrogen Growth
Fair Value €14.40|31.6% undervalued
CH
Community Contributor
Tesla’s Nvidia Moment – The AI & Robotics Inflection Point
Fair Value US$359.72|12.3% undervalued
BL
Community Contributor