
Advertisement
- United Kingdom
- /
- Software
- /
- AIM:OMG
Oxford Metrics' (LON:OMG) one-year decline in earnings translates into losses for shareholders

It's nice to see the Oxford Metrics plc (LON:OMG) share price up 11% in a week. But that is minimal compensation for the share price under-performance over the last year. In fact, the price has declined 51% in a year, falling short of the returns you could get by investing in an index fund.
The recent uptick of 11% could be a positive sign of things to come, so let's take a look at historical fundamentals.
While markets are a powerful pricing mechanism, share prices reflect investor sentiment, not just underlying business performance. One imperfect but simple way to consider how the market perception of a company has shifted is to compare the change in the earnings per share (EPS) with the share price movement.
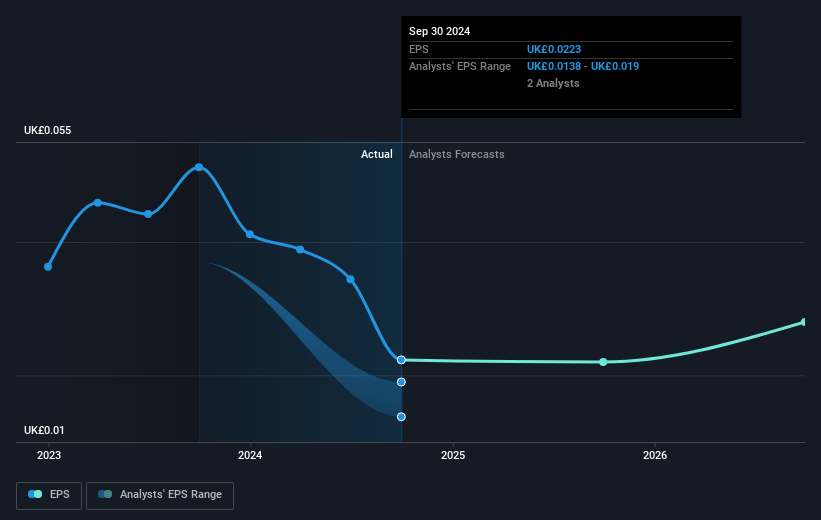
Unfortunately Oxford Metrics reported an EPS drop of 56% for the last year. This proportional reduction in earnings per share isn't far from the 51% decrease in the share price. Given the lower EPS we might have expected investors to lose confidence in the stock, but that doesn't seemed to have happened. Rather, the share price is remains a similar multiple of the EPS, suggesting the outlook remains the same.
The company's earnings per share (over time) is depicted in the image below (click to see the exact numbers).
This free interactive report on Oxford Metrics' earnings, revenue and cash flow is a great place to start, if you want to investigate the stock further.
What About Dividends?
When looking at investment returns, it is important to consider the difference between total shareholder return (TSR) and share price return. The TSR incorporates the value of any spin-offs or discounted capital raisings, along with any dividends, based on the assumption that the dividends are reinvested. Arguably, the TSR gives a more comprehensive picture of the return generated by a stock. As it happens, Oxford Metrics' TSR for the last 1 year was -49%, which exceeds the share price return mentioned earlier. And there's no prize for guessing that the dividend payments largely explain the divergence!
A Different Perspective
Investors in Oxford Metrics had a tough year, with a total loss of 49% (including dividends), against a market gain of about 5.6%. Even the share prices of good stocks drop sometimes, but we want to see improvements in the fundamental metrics of a business, before getting too interested. Unfortunately, last year's performance may indicate unresolved challenges, given that it was worse than the annualised loss of 7% over the last half decade. We realise that Baron Rothschild has said investors should "buy when there is blood on the streets", but we caution that investors should first be sure they are buying a high quality business. It's always interesting to track share price performance over the longer term. But to understand Oxford Metrics better, we need to consider many other factors. Consider for instance, the ever-present spectre of investment risk. We've identified 4 warning signs with Oxford Metrics (at least 2 which shouldn't be ignored) , and understanding them should be part of your investment process.
If you would prefer to check out another company -- one with potentially superior financials -- then do not miss this free list of companies that have proven they can grow earnings.
Please note, the market returns quoted in this article reflect the market weighted average returns of stocks that currently trade on British exchanges.
New: AI Stock Screener & Alerts
Our new AI Stock Screener scans the market every day to uncover opportunities.
• Dividend Powerhouses (3%+ Yield)
• Undervalued Small Caps with Insider Buying
• High growth Tech and AI Companies
Or build your own from over 50 metrics.
Have feedback on this article? Concerned about the content? Get in touch with us directly. Alternatively, email editorial-team (at) simplywallst.com.
This article by Simply Wall St is general in nature. We provide commentary based on historical data and analyst forecasts only using an unbiased methodology and our articles are not intended to be financial advice. It does not constitute a recommendation to buy or sell any stock, and does not take account of your objectives, or your financial situation. We aim to bring you long-term focused analysis driven by fundamental data. Note that our analysis may not factor in the latest price-sensitive company announcements or qualitative material. Simply Wall St has no position in any stocks mentioned.
About AIM:OMG
Oxford Metrics
Operates as a smart sensing and software company in the United Kingdom.
Flawless balance sheet slight.
Market Insights

Advertisement
Community Narratives
WhiteCap Is Positioned To Profit Regardless Of Trump's Policy 
Fair Value CA$22.60|61.6% undervalued
ST
Equity Analyst and Writer
Microsoft's Evolution Will Drive Revenue to New Heights Fueled by AI
Fair Value US$360.00|28.6% overvalued
BR
Community Contributor
A CASE FOR USD$2.50 (CAD$3.44) BY 2028 (A 5-10 BAGGER)
Fair Value CA$3.44|87.5% undervalued
AG
Community Contributor