
Advertisement
- United Kingdom
- /
- IT
- /
- AIM:IOM
iomart Group's (LON:IOM) earnings have declined over five years, contributing to shareholders 50% loss

It is doubtless a positive to see that the iomart Group plc (LON:IOM) share price has gained some 36% in the last three months. But that is little comfort to those holding over the last half decade, sitting on a big loss. In that time the share price has delivered a rude shock to holders, who find themselves down 56% after a long stretch. So is the recent increase sufficient to restore confidence in the stock? Not yet. We'd err towards caution given the long term under-performance.
While the stock has risen 11% in the past week but long term shareholders are still in the red, let's see what the fundamentals can tell us.
View our latest analysis for iomart Group
SWOT Analysis for iomart Group
Strength
- Debt is not viewed as a risk.
- Dividends are covered by earnings and cash flows.
Weakness
- Earnings declined over the past year.
- Dividend is low compared to the top 25% of dividend payers in the IT market.
- Expensive based on P/E ratio and estimated fair value.
Opportunity
- Annual revenue is forecast to grow faster than the British market.
Threat
- Annual earnings are forecast to decline for the next 3 years.
While markets are a powerful pricing mechanism, share prices reflect investor sentiment, not just underlying business performance. By comparing earnings per share (EPS) and share price changes over time, we can get a feel for how investor attitudes to a company have morphed over time.
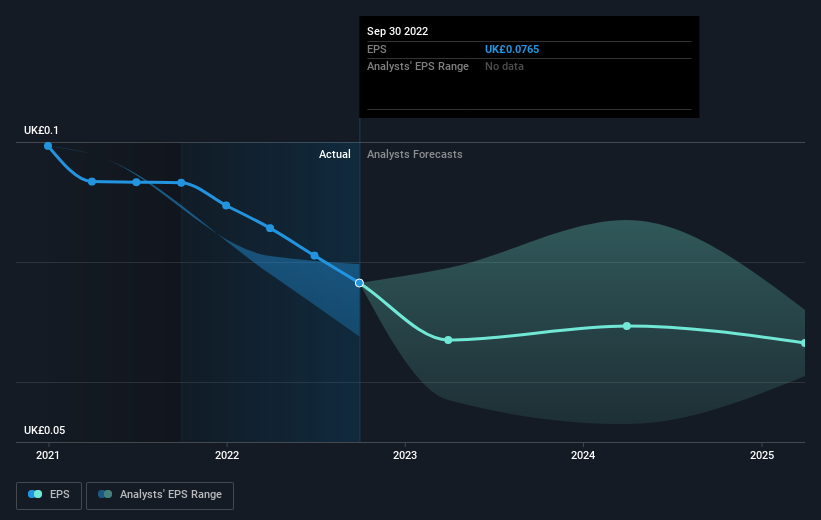
Looking back five years, both iomart Group's share price and EPS declined; the latter at a rate of 8.6% per year. This reduction in EPS is less than the 15% annual reduction in the share price. This implies that the market is more cautious about the business these days.
The image below shows how EPS has tracked over time (if you click on the image you can see greater detail).
Dive deeper into iomart Group's key metrics by checking this interactive graph of iomart Group's earnings, revenue and cash flow.
What About Dividends?
When looking at investment returns, it is important to consider the difference between total shareholder return (TSR) and share price return. The TSR incorporates the value of any spin-offs or discounted capital raisings, along with any dividends, based on the assumption that the dividends are reinvested. Arguably, the TSR gives a more comprehensive picture of the return generated by a stock. We note that for iomart Group the TSR over the last 5 years was -50%, which is better than the share price return mentioned above. This is largely a result of its dividend payments!
A Different Perspective
While the broader market lost about 0.8% in the twelve months, iomart Group shareholders did even worse, losing 4.3% (even including dividends). Having said that, it's inevitable that some stocks will be oversold in a falling market. The key is to keep your eyes on the fundamental developments. Unfortunately, longer term shareholders are suffering worse, given the loss of 9% doled out over the last five years. We would want clear information suggesting the company will grow, before taking the view that the share price will stabilize. While it is well worth considering the different impacts that market conditions can have on the share price, there are other factors that are even more important. Case in point: We've spotted 2 warning signs for iomart Group you should be aware of, and 1 of them is concerning.
But note: iomart Group may not be the best stock to buy. So take a peek at this free list of interesting companies with past earnings growth (and further growth forecast).
Please note, the market returns quoted in this article reflect the market weighted average returns of stocks that currently trade on British exchanges.
Valuation is complex, but we're here to simplify it.
Discover if iomart Group might be undervalued or overvalued with our detailed analysis, featuring fair value estimates, potential risks, dividends, insider trades, and its financial condition.
Access Free AnalysisHave feedback on this article? Concerned about the content? Get in touch with us directly. Alternatively, email editorial-team (at) simplywallst.com.
This article by Simply Wall St is general in nature. We provide commentary based on historical data and analyst forecasts only using an unbiased methodology and our articles are not intended to be financial advice. It does not constitute a recommendation to buy or sell any stock, and does not take account of your objectives, or your financial situation. We aim to bring you long-term focused analysis driven by fundamental data. Note that our analysis may not factor in the latest price-sensitive company announcements or qualitative material. Simply Wall St has no position in any stocks mentioned.
About AIM:IOM
iomart Group
Engages in the provision of cloud and managed hosting services in the United Kingdom and internationally.
Moderate, good value and pays a dividend.
Similar Companies
Market Insights

Advertisement
Community Narratives
Groundbreaking therapies that could change the treatment landscape for PTSD, fibromyalgia, MS & Alzheimer’s
Fair Value US$6.20|86.9% undervalued
CM
Community Contributor
DigitalOcean Will Grow 14% by Embracing AI with Paperspace Acquisition
Fair Value US$50.00|41.7% undervalued
NE
Community Contributor
Viant Technology: A Rising AdTech Challenger in the AI-Powered CTV Market
Fair Value US$38.61|63.2% undervalued
BL
Community Contributor
Volvo will Accelerate Forward into Electric and Autonomous Leadership in Five Years
Fair Value SEK 438.80|39.7% undervalued
UN
Community Contributor