
Advertisement
NEXT (LON:NXT) investors are sitting on a loss of 26% if they invested a year ago

NEXT plc (LON:NXT) shareholders should be happy to see the share price up 20% in the last quarter. But that doesn't change the fact that the returns over the last year have been less than pleasing. In fact, the price has declined 29% in a year, falling short of the returns you could get by investing in an index fund.
So let's have a look and see if the longer term performance of the company has been in line with the underlying business' progress.
Check out our latest analysis for NEXT
To quote Buffett, 'Ships will sail around the world but the Flat Earth Society will flourish. There will continue to be wide discrepancies between price and value in the marketplace...' One imperfect but simple way to consider how the market perception of a company has shifted is to compare the change in the earnings per share (EPS) with the share price movement.
Even though the NEXT share price is down over the year, its EPS actually improved. Of course, the situation might betray previous over-optimism about growth.
The divergence between the EPS and the share price is quite notable, during the year. But we might find some different metrics explain the share price movements better.
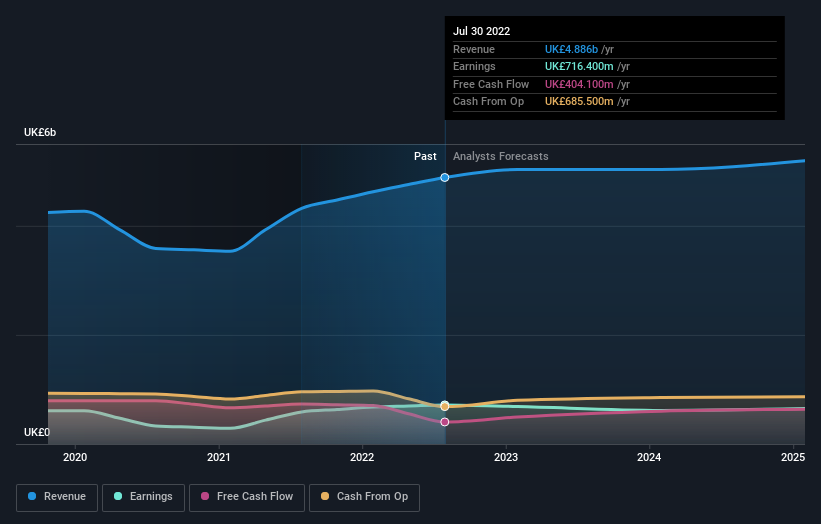
NEXT's revenue is actually up 13% over the last year. Since we can't easily explain the share price movement based on these metrics, it might be worth considering how market sentiment has changed towards the stock.
The graphic below depicts how earnings and revenue have changed over time (unveil the exact values by clicking on the image).
We consider it positive that insiders have made significant purchases in the last year. Even so, future earnings will be far more important to whether current shareholders make money. You can see what analysts are predicting for NEXT in this interactive graph of future profit estimates.
What About Dividends?
When looking at investment returns, it is important to consider the difference between total shareholder return (TSR) and share price return. Whereas the share price return only reflects the change in the share price, the TSR includes the value of dividends (assuming they were reinvested) and the benefit of any discounted capital raising or spin-off. It's fair to say that the TSR gives a more complete picture for stocks that pay a dividend. In the case of NEXT, it has a TSR of -26% for the last 1 year. That exceeds its share price return that we previously mentioned. The dividends paid by the company have thusly boosted the total shareholder return.
A Different Perspective
We regret to report that NEXT shareholders are down 26% for the year (even including dividends). Unfortunately, that's worse than the broader market decline of 5.4%. However, it could simply be that the share price has been impacted by broader market jitters. It might be worth keeping an eye on the fundamentals, in case there's a good opportunity. Longer term investors wouldn't be so upset, since they would have made 6%, each year, over five years. It could be that the recent sell-off is an opportunity, so it may be worth checking the fundamental data for signs of a long term growth trend. I find it very interesting to look at share price over the long term as a proxy for business performance. But to truly gain insight, we need to consider other information, too. Like risks, for instance. Every company has them, and we've spotted 3 warning signs for NEXT (of which 1 is concerning!) you should know about.
There are plenty of other companies that have insiders buying up shares. You probably do not want to miss this free list of growing companies that insiders are buying.
Please note, the market returns quoted in this article reflect the market weighted average returns of stocks that currently trade on GB exchanges.
Valuation is complex, but we're here to simplify it.
Discover if NEXT might be undervalued or overvalued with our detailed analysis, featuring fair value estimates, potential risks, dividends, insider trades, and its financial condition.
Access Free AnalysisHave feedback on this article? Concerned about the content? Get in touch with us directly. Alternatively, email editorial-team (at) simplywallst.com.
This article by Simply Wall St is general in nature. We provide commentary based on historical data and analyst forecasts only using an unbiased methodology and our articles are not intended to be financial advice. It does not constitute a recommendation to buy or sell any stock, and does not take account of your objectives, or your financial situation. We aim to bring you long-term focused analysis driven by fundamental data. Note that our analysis may not factor in the latest price-sensitive company announcements or qualitative material. Simply Wall St has no position in any stocks mentioned.
About LSE:NXT
NEXT
Engages in the retail of clothing, homeware, and beauty products in the United Kingdom, rest of Europe, the Middle East, Asia, and internationally.
Flawless balance sheet with moderate growth potential.
Similar Companies
Market Insights

Advertisement
Community Narratives
Groundbreaking therapies that could change the treatment landscape for PTSD, fibromyalgia, MS & Alzheimer’s
Fair Value US$6.20|82.7% undervalued
CM
Community Contributor
DigitalOcean Will Grow 14% by Embracing AI with Paperspace Acquisition
Fair Value US$50.00|36.8% undervalued
NE
Community Contributor
Viant Technology: A Rising AdTech Challenger in the AI-Powered CTV Market
Fair Value US$38.61|61.4% undervalued
BL
Community Contributor
Volvo will Accelerate Forward into Electric and Autonomous Leadership in Five Years
Fair Value SEK 438.80|37.1% undervalued
UN
Community Contributor