
Advertisement
Legendary fund manager Li Lu (who Charlie Munger backed) once said, 'The biggest investment risk is not the volatility of prices, but whether you will suffer a permanent loss of capital.' So it might be obvious that you need to consider debt, when you think about how risky any given stock is, because too much debt can sink a company. We can see that Frasers Group Plc (LON:FRAS) does use debt in its business. But should shareholders be worried about its use of debt?
Why Does Debt Bring Risk?
Debt and other liabilities become risky for a business when it cannot easily fulfill those obligations, either with free cash flow or by raising capital at an attractive price. If things get really bad, the lenders can take control of the business. However, a more common (but still painful) scenario is that it has to raise new equity capital at a low price, thus permanently diluting shareholders. Of course, plenty of companies use debt to fund growth, without any negative consequences. When we think about a company's use of debt, we first look at cash and debt together.
See our latest analysis for Frasers Group
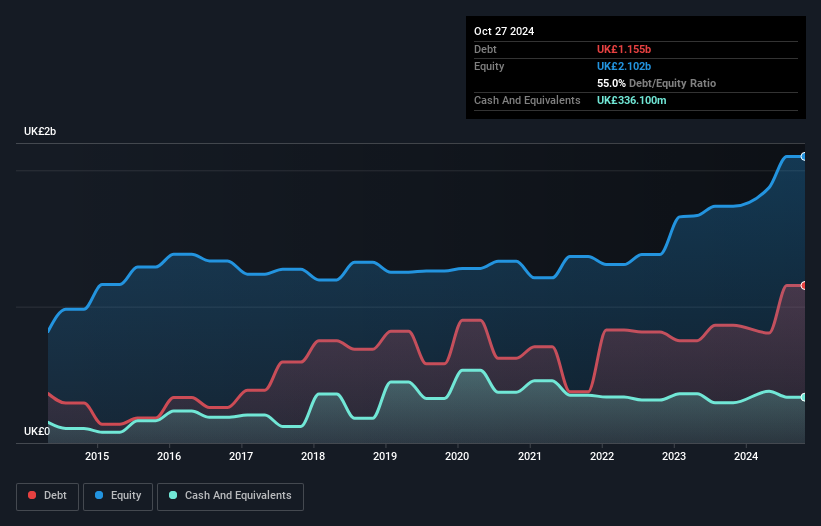
What Is Frasers Group's Net Debt?
The image below, which you can click on for greater detail, shows that at October 2024 Frasers Group had debt of UK£1.16b, up from UK£864.2m in one year. On the flip side, it has UK£336.1m in cash leading to net debt of about UK£818.9m.
How Strong Is Frasers Group's Balance Sheet?
According to the last reported balance sheet, Frasers Group had liabilities of UK£1.07b due within 12 months, and liabilities of UK£1.89b due beyond 12 months. Offsetting these obligations, it had cash of UK£336.1m as well as receivables valued at UK£421.4m due within 12 months. So its liabilities outweigh the sum of its cash and (near-term) receivables by UK£2.20b.
This is a mountain of leverage relative to its market capitalization of UK£2.64b. Should its lenders demand that it shore up the balance sheet, shareholders would likely face severe dilution.
We use two main ratios to inform us about debt levels relative to earnings. The first is net debt divided by earnings before interest, tax, depreciation, and amortization (EBITDA), while the second is how many times its earnings before interest and tax (EBIT) covers its interest expense (or its interest cover, for short). Thus we consider debt relative to earnings both with and without depreciation and amortization expenses.
Frasers Group has a low debt to EBITDA ratio of only 1.2. And remarkably, despite having net debt, it actually received more in interest over the last twelve months than it had to pay. So there's no doubt this company can take on debt while staying cool as a cucumber. On the other hand, Frasers Group saw its EBIT drop by 3.1% in the last twelve months. If earnings continue to decline at that rate the company may have increasing difficulty managing its debt load. When analysing debt levels, the balance sheet is the obvious place to start. But it is future earnings, more than anything, that will determine Frasers Group's ability to maintain a healthy balance sheet going forward. So if you want to see what the professionals think, you might find this free report on analyst profit forecasts to be interesting.
Finally, a company can only pay off debt with cold hard cash, not accounting profits. So we always check how much of that EBIT is translated into free cash flow. Looking at the most recent three years, Frasers Group recorded free cash flow of 39% of its EBIT, which is weaker than we'd expect. That weak cash conversion makes it more difficult to handle indebtedness.
Our View
Frasers Group's level of total liabilities and EBIT growth rate definitely weigh on it, in our esteem. But its interest cover tells a very different story, and suggests some resilience. Looking at all the angles mentioned above, it does seem to us that Frasers Group is a somewhat risky investment as a result of its debt. Not all risk is bad, as it can boost share price returns if it pays off, but this debt risk is worth keeping in mind. When analysing debt levels, the balance sheet is the obvious place to start. But ultimately, every company can contain risks that exist outside of the balance sheet. These risks can be hard to spot. Every company has them, and we've spotted 2 warning signs for Frasers Group you should know about.
At the end of the day, it's often better to focus on companies that are free from net debt. You can access our special list of such companies (all with a track record of profit growth). It's free.
New: AI Stock Screener & Alerts
Our new AI Stock Screener scans the market every day to uncover opportunities.
• Dividend Powerhouses (3%+ Yield)
• Undervalued Small Caps with Insider Buying
• High growth Tech and AI Companies
Or build your own from over 50 metrics.
Have feedback on this article? Concerned about the content? Get in touch with us directly. Alternatively, email editorial-team (at) simplywallst.com.
This article by Simply Wall St is general in nature. We provide commentary based on historical data and analyst forecasts only using an unbiased methodology and our articles are not intended to be financial advice. It does not constitute a recommendation to buy or sell any stock, and does not take account of your objectives, or your financial situation. We aim to bring you long-term focused analysis driven by fundamental data. Note that our analysis may not factor in the latest price-sensitive company announcements or qualitative material. Simply Wall St has no position in any stocks mentioned.
About LSE:FRAS
Frasers Group
Engages in the retail and wholesale of sports and leisure clothing, footwear and equipment, and apparel through department stores, shops, and online.
Excellent balance sheet and fair value.
Similar Companies
Market Insights


Advertisement
Community Narratives
The Next Phase of Energy Storage: How NeoVolta Is Tackling America’s Power Crunch
Fair Value US$7.50|40.5% undervalued
MA
Community Contributor
Why EnSilica is Worth Possibly 13x its Current Price
Fair Value UK£5.00|91.8% undervalued
DO
Community Contributor
M&A Activity, Industry Diversification & A Defense Contract Monopoly Will Push BWXT For Healthy Long-Term Growth
Fair Value US$220.00|16.2% undervalued
CL
Community Contributor
A case for Cassiar Gold Corp (TSXV: GLDC) to reach CAD$8-10 before 2030 (X30-37)
Fair Value CA$10.00|97.5% undervalued
AG
Community Contributor