
Advertisement
- United Kingdom
- /
- Media
- /
- LSE:WPP
WPP plc's (LON:WPP) Intrinsic Value Is Potentially 100% Above Its Share Price
Key Insights
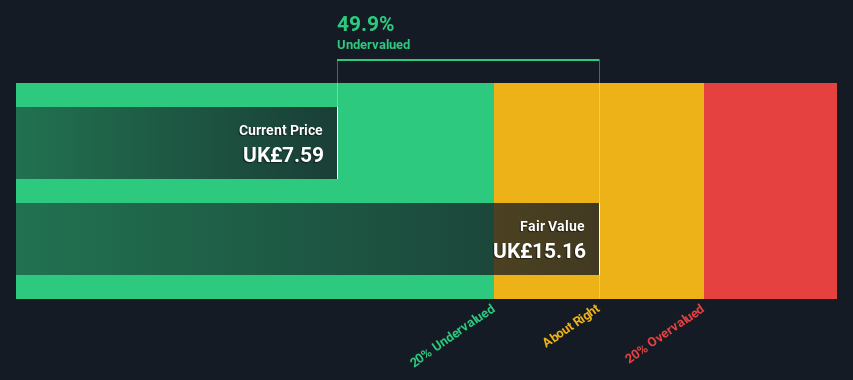
- The projected fair value for WPP is UK£15.16 based on 2 Stage Free Cash Flow to Equity
- WPP's UK£7.59 share price signals that it might be 50% undervalued
- Our fair value estimate is 65% higher than WPP's analyst price target of UK£9.22
Today we'll do a simple run through of a valuation method used to estimate the attractiveness of WPP plc (LON:WPP) as an investment opportunity by projecting its future cash flows and then discounting them to today's value. One way to achieve this is by employing the Discounted Cash Flow (DCF) model. Models like these may appear beyond the comprehension of a lay person, but they're fairly easy to follow.
Companies can be valued in a lot of ways, so we would point out that a DCF is not perfect for every situation. Anyone interested in learning a bit more about intrinsic value should have a read of the Simply Wall St analysis model.
See our latest analysis for WPP
The Model
We're using the 2-stage growth model, which simply means we take in account two stages of company's growth. In the initial period the company may have a higher growth rate and the second stage is usually assumed to have a stable growth rate. To begin with, we have to get estimates of the next ten years of cash flows. Where possible we use analyst estimates, but when these aren't available we extrapolate the previous free cash flow (FCF) from the last estimate or reported value. We assume companies with shrinking free cash flow will slow their rate of shrinkage, and that companies with growing free cash flow will see their growth rate slow, over this period. We do this to reflect that growth tends to slow more in the early years than it does in later years.
Generally we assume that a dollar today is more valuable than a dollar in the future, so we discount the value of these future cash flows to their estimated value in today's dollars:
10-year free cash flow (FCF) estimate
| 2024 | 2025 | 2026 | 2027 | 2028 | 2029 | 2030 | 2031 | 2032 | 2033 | |
| Levered FCF (£, Millions) | UK£1.11b | UK£1.24b | UK£1.20b | UK£1.25b | UK£1.28b | UK£1.31b | UK£1.33b | UK£1.36b | UK£1.38b | UK£1.41b |
| Growth Rate Estimate Source | Analyst x6 | Analyst x6 | Analyst x2 | Analyst x1 | Est @ 2.64% | Est @ 2.30% | Est @ 2.07% | Est @ 1.90% | Est @ 1.79% | Est @ 1.71% |
| Present Value (£, Millions) Discounted @ 9.0% | UK£1.0k | UK£1.0k | UK£928 | UK£882 | UK£831 | UK£780 | UK£730 | UK£683 | UK£638 | UK£595 |
("Est" = FCF growth rate estimated by Simply Wall St)
Present Value of 10-year Cash Flow (PVCF) = UK£8.1b
We now need to calculate the Terminal Value, which accounts for all the future cash flows after this ten year period. For a number of reasons a very conservative growth rate is used that cannot exceed that of a country's GDP growth. In this case we have used the 5-year average of the 10-year government bond yield (1.5%) to estimate future growth. In the same way as with the 10-year 'growth' period, we discount future cash flows to today's value, using a cost of equity of 9.0%.
Terminal Value (TV)= FCF2033 × (1 + g) ÷ (r – g) = UK£1.4b× (1 + 1.5%) ÷ (9.0%– 1.5%) = UK£19b
Present Value of Terminal Value (PVTV)= TV / (1 + r)10= UK£19b÷ ( 1 + 9.0%)10= UK£8.1b
The total value is the sum of cash flows for the next ten years plus the discounted terminal value, which results in the Total Equity Value, which in this case is UK£16b. The last step is to then divide the equity value by the number of shares outstanding. Compared to the current share price of UK£7.6, the company appears quite good value at a 50% discount to where the stock price trades currently. The assumptions in any calculation have a big impact on the valuation, so it is better to view this as a rough estimate, not precise down to the last cent.
Important Assumptions
Now the most important inputs to a discounted cash flow are the discount rate, and of course, the actual cash flows. You don't have to agree with these inputs, I recommend redoing the calculations yourself and playing with them. The DCF also does not consider the possible cyclicality of an industry, or a company's future capital requirements, so it does not give a full picture of a company's potential performance. Given that we are looking at WPP as potential shareholders, the cost of equity is used as the discount rate, rather than the cost of capital (or weighted average cost of capital, WACC) which accounts for debt. In this calculation we've used 9.0%, which is based on a levered beta of 1.264. Beta is a measure of a stock's volatility, compared to the market as a whole. We get our beta from the industry average beta of globally comparable companies, with an imposed limit between 0.8 and 2.0, which is a reasonable range for a stable business.
SWOT Analysis for WPP
Strength
- Debt is well covered by earnings and cashflows.
- Dividends are covered by earnings and cash flows.
Weakness
- Earnings declined over the past year.
- Dividend is low compared to the top 25% of dividend payers in the Media market.
Opportunity
- Annual earnings are forecast to grow faster than the British market.
- Good value based on P/E ratio and estimated fair value.
Threat
- Annual revenue is expected to decline over the next 3 years.
Next Steps:
Although the valuation of a company is important, it is only one of many factors that you need to assess for a company. DCF models are not the be-all and end-all of investment valuation. Instead the best use for a DCF model is to test certain assumptions and theories to see if they would lead to the company being undervalued or overvalued. For instance, if the terminal value growth rate is adjusted slightly, it can dramatically alter the overall result. What is the reason for the share price sitting below the intrinsic value? For WPP, we've compiled three additional factors you should explore:
- Risks: For instance, we've identified 2 warning signs for WPP that you should be aware of.
- Management:Have insiders been ramping up their shares to take advantage of the market's sentiment for WPP's future outlook? Check out our management and board analysis with insights on CEO compensation and governance factors.
- Other High Quality Alternatives: Do you like a good all-rounder? Explore our interactive list of high quality stocks to get an idea of what else is out there you may be missing!
PS. The Simply Wall St app conducts a discounted cash flow valuation for every stock on the LSE every day. If you want to find the calculation for other stocks just search here.
Valuation is complex, but we're here to simplify it.
Discover if WPP might be undervalued or overvalued with our detailed analysis, featuring fair value estimates, potential risks, dividends, insider trades, and its financial condition.
Access Free AnalysisHave feedback on this article? Concerned about the content? Get in touch with us directly. Alternatively, email editorial-team (at) simplywallst.com.
This article by Simply Wall St is general in nature. We provide commentary based on historical data and analyst forecasts only using an unbiased methodology and our articles are not intended to be financial advice. It does not constitute a recommendation to buy or sell any stock, and does not take account of your objectives, or your financial situation. We aim to bring you long-term focused analysis driven by fundamental data. Note that our analysis may not factor in the latest price-sensitive company announcements or qualitative material. Simply Wall St has no position in any stocks mentioned.
About LSE:WPP
WPP
A creative transformation company, provides communications, experience, commerce, and technology services in North America, the United Kingdom, Western Continental Europe, the Asia Pacific, Latin America, Africa, the Middle East, and Central and Eastern Europe.
Undervalued with solid track record.
Similar Companies
Market Insights

Advertisement
Community Narratives
The company that turned a verb into a global necessity and basically runs the modern internet, digital ads, smartphones, maps, and AI.
Fair Value US$300.00|5.1% undervalued
OS
Community Contributor
Flowers Foods Pays A Fair Price For Health
Fair Value US$16.12|27.7% undervalued
NV
Community Contributor
TMX Group will thrive with 33.3% profit margin and enduring market moat
Fair Value CA$49.90|0.2% overvalued
LI
Community Contributor
The "Molecular Pencil": Why Beam's Technology is Built to Win
Fair Value US$65.01|64.4% undervalued
DA
Community Contributor