
Advertisement
MONY Group (LON:MONY) stock falls 3.3% in past week as five-year earnings and shareholder returns continue downward trend

Ideally, your overall portfolio should beat the market average. But in any portfolio, there will be mixed results between individual stocks. So we wouldn't blame long term MONY Group plc (LON:MONY) shareholders for doubting their decision to hold, with the stock down 43% over a half decade.
Given the past week has been tough on shareholders, let's investigate the fundamentals and see what we can learn.
Check out our latest analysis for MONY Group
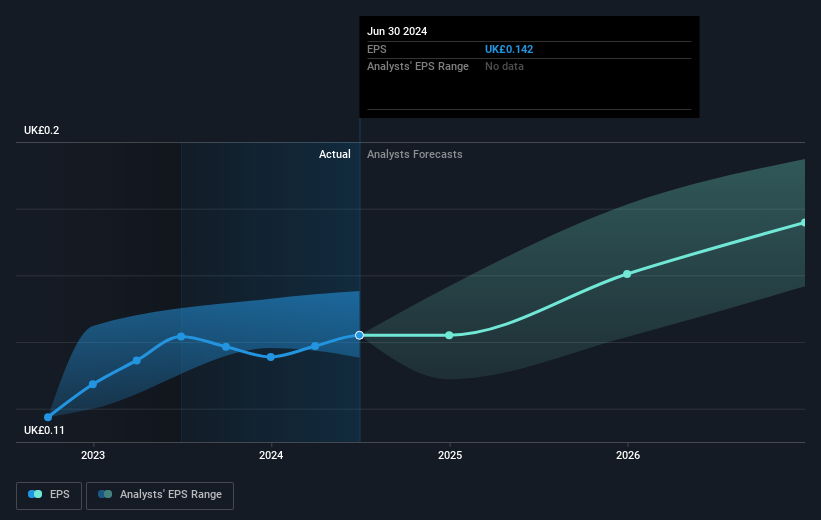
To quote Buffett, 'Ships will sail around the world but the Flat Earth Society will flourish. There will continue to be wide discrepancies between price and value in the marketplace...' One flawed but reasonable way to assess how sentiment around a company has changed is to compare the earnings per share (EPS) with the share price.
Looking back five years, both MONY Group's share price and EPS declined; the latter at a rate of 4.2% per year. This reduction in EPS is less than the 11% annual reduction in the share price. So it seems the market was too confident about the business, in the past.
The graphic below depicts how EPS has changed over time (unveil the exact values by clicking on the image).
This free interactive report on MONY Group's earnings, revenue and cash flow is a great place to start, if you want to investigate the stock further.
What About Dividends?
It is important to consider the total shareholder return, as well as the share price return, for any given stock. Whereas the share price return only reflects the change in the share price, the TSR includes the value of dividends (assuming they were reinvested) and the benefit of any discounted capital raising or spin-off. So for companies that pay a generous dividend, the TSR is often a lot higher than the share price return. In the case of MONY Group, it has a TSR of -28% for the last 5 years. That exceeds its share price return that we previously mentioned. And there's no prize for guessing that the dividend payments largely explain the divergence!
A Different Perspective
MONY Group shareholders are down 9.1% for the year (even including dividends), but the market itself is up 14%. However, keep in mind that even the best stocks will sometimes underperform the market over a twelve month period. Regrettably, last year's performance caps off a bad run, with the shareholders facing a total loss of 5% per year over five years. Generally speaking long term share price weakness can be a bad sign, though contrarian investors might want to research the stock in hope of a turnaround. If you would like to research MONY Group in more detail then you might want to take a look at whether insiders have been buying or selling shares in the company.
If you are like me, then you will not want to miss this free list of undervalued small caps that insiders are buying.
Please note, the market returns quoted in this article reflect the market weighted average returns of stocks that currently trade on British exchanges.
New: Manage All Your Stock Portfolios in One Place
We've created the ultimate portfolio companion for stock investors, and it's free.
• Connect an unlimited number of Portfolios and see your total in one currency
• Be alerted to new Warning Signs or Risks via email or mobile
• Track the Fair Value of your stocks
Have feedback on this article? Concerned about the content? Get in touch with us directly. Alternatively, email editorial-team (at) simplywallst.com.
This article by Simply Wall St is general in nature. We provide commentary based on historical data and analyst forecasts only using an unbiased methodology and our articles are not intended to be financial advice. It does not constitute a recommendation to buy or sell any stock, and does not take account of your objectives, or your financial situation. We aim to bring you long-term focused analysis driven by fundamental data. Note that our analysis may not factor in the latest price-sensitive company announcements or qualitative material. Simply Wall St has no position in any stocks mentioned.
About LSE:MONY
MONY Group
Engages in the provision of price comparison and lead generation services through its websites and applications in the United Kingdom.
Very undervalued 6 star dividend payer.
Market Insights

Advertisement
Community Narratives

BMW cruising ahead with new EVs and premium models to boost revenue 5%
Fair Value €135.07|43.3% undervalued
UN
Community Contributor
EU#2 - From Humble Beginnings to Global Powerhouse
Fair Value DKK 851.04|50.1% undervalued
TO
Community Contributor