
Advertisement
Does Auto Trader Group (LON:AUTO) Have A Healthy Balance Sheet?

Some say volatility, rather than debt, is the best way to think about risk as an investor, but Warren Buffett famously said that 'Volatility is far from synonymous with risk.' So it might be obvious that you need to consider debt, when you think about how risky any given stock is, because too much debt can sink a company. Importantly, Auto Trader Group plc (LON:AUTO) does carry debt. But is this debt a concern to shareholders?
When Is Debt Dangerous?
Generally speaking, debt only becomes a real problem when a company can't easily pay it off, either by raising capital or with its own cash flow. In the worst case scenario, a company can go bankrupt if it cannot pay its creditors. While that is not too common, we often do see indebted companies permanently diluting shareholders because lenders force them to raise capital at a distressed price. Of course, debt can be an important tool in businesses, particularly capital heavy businesses. When we examine debt levels, we first consider both cash and debt levels, together.
View our latest analysis for Auto Trader Group
What Is Auto Trader Group's Debt?
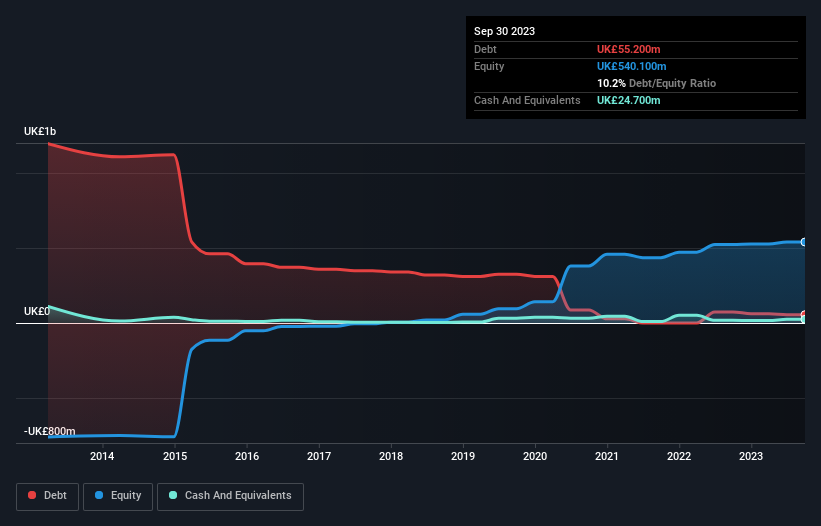
As you can see below, Auto Trader Group had UK£55.2m of debt at September 2023, down from UK£73.9m a year prior. On the flip side, it has UK£24.7m in cash leading to net debt of about UK£30.5m.
A Look At Auto Trader Group's Liabilities
We can see from the most recent balance sheet that Auto Trader Group had liabilities of UK£66.3m falling due within a year, and liabilities of UK£67.6m due beyond that. On the other hand, it had cash of UK£24.7m and UK£74.1m worth of receivables due within a year. So it has liabilities totalling UK£35.1m more than its cash and near-term receivables, combined.
This state of affairs indicates that Auto Trader Group's balance sheet looks quite solid, as its total liabilities are just about equal to its liquid assets. So while it's hard to imagine that the UK£6.56b company is struggling for cash, we still think it's worth monitoring its balance sheet. But either way, Auto Trader Group has virtually no net debt, so it's fair to say it does not have a heavy debt load!
In order to size up a company's debt relative to its earnings, we calculate its net debt divided by its earnings before interest, tax, depreciation, and amortization (EBITDA) and its earnings before interest and tax (EBIT) divided by its interest expense (its interest cover). Thus we consider debt relative to earnings both with and without depreciation and amortization expenses.
Auto Trader Group has very little debt (net of cash), and boasts a debt to EBITDA ratio of 0.09 and EBIT of 86.1 times the interest expense. So relative to past earnings, the debt load seems trivial. Fortunately, Auto Trader Group grew its EBIT by 8.7% in the last year, making that debt load look even more manageable. The balance sheet is clearly the area to focus on when you are analysing debt. But it is future earnings, more than anything, that will determine Auto Trader Group's ability to maintain a healthy balance sheet going forward. So if you're focused on the future you can check out this free report showing analyst profit forecasts.
Finally, a business needs free cash flow to pay off debt; accounting profits just don't cut it. So it's worth checking how much of that EBIT is backed by free cash flow. During the last three years, Auto Trader Group generated free cash flow amounting to a very robust 86% of its EBIT, more than we'd expect. That puts it in a very strong position to pay down debt.
Our View
The good news is that Auto Trader Group's demonstrated ability to cover its interest expense with its EBIT delights us like a fluffy puppy does a toddler. And that's just the beginning of the good news since its conversion of EBIT to free cash flow is also very heartening. Overall, we don't think Auto Trader Group is taking any bad risks, as its debt load seems modest. So the balance sheet looks pretty healthy, to us. Above most other metrics, we think its important to track how fast earnings per share is growing, if at all. If you've also come to that realization, you're in luck, because today you can view this interactive graph of Auto Trader Group's earnings per share history for free.
If, after all that, you're more interested in a fast growing company with a rock-solid balance sheet, then check out our list of net cash growth stocks without delay.
New: Manage All Your Stock Portfolios in One Place
We've created the ultimate portfolio companion for stock investors, and it's free.
• Connect an unlimited number of Portfolios and see your total in one currency
• Be alerted to new Warning Signs or Risks via email or mobile
• Track the Fair Value of your stocks
Have feedback on this article? Concerned about the content? Get in touch with us directly. Alternatively, email editorial-team (at) simplywallst.com.
This article by Simply Wall St is general in nature. We provide commentary based on historical data and analyst forecasts only using an unbiased methodology and our articles are not intended to be financial advice. It does not constitute a recommendation to buy or sell any stock, and does not take account of your objectives, or your financial situation. We aim to bring you long-term focused analysis driven by fundamental data. Note that our analysis may not factor in the latest price-sensitive company announcements or qualitative material. Simply Wall St has no position in any stocks mentioned.
About LSE:AUTO
Auto Trader Group
Operates in the digital automotive marketplace in the United Kingdom and Ireland.
Outstanding track record with flawless balance sheet.
Similar Companies
Market Insights


Advertisement
Community Narratives
Nike's Direct-to-Consumer Focus Will Drive Future Growth
Fair Value US$87.90|18.2% undervalued
UN
Community Contributor
Novo Nordisk will dominate GLP-1 market with Ozempic and Wegovy growth
Fair Value US$89.59|12.1% undervalued
BE
Community Contributor
Rheinmetall could get 20-25% of EU-NATO 3%-GDP defence spending
Fair Value €7.57k|82.4% undervalued
NO
Community Contributor