
Advertisement
- United Kingdom
- /
- Media
- /
- AIM:TMG
Should You Be Impressed By Mission Group's (LON:TMG) Returns on Capital?

To find a multi-bagger stock, what are the underlying trends we should look for in a business? Firstly, we'd want to identify a growing return on capital employed (ROCE) and then alongside that, an ever-increasing base of capital employed. If you see this, it typically means it's a company with a great business model and plenty of profitable reinvestment opportunities. In light of that, when we looked at Mission Group (LON:TMG) and its ROCE trend, we weren't exactly thrilled.
Return On Capital Employed (ROCE): What is it?
For those who don't know, ROCE is a measure of a company's yearly pre-tax profit (its return), relative to the capital employed in the business. The formula for this calculation on Mission Group is:
Return on Capital Employed = Earnings Before Interest and Tax (EBIT) ÷ (Total Assets - Current Liabilities)
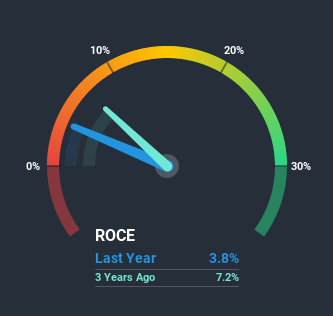
0.038 = UK£4.1m ÷ (UK£146m - UK£39m) (Based on the trailing twelve months to June 2020).
So, Mission Group has an ROCE of 3.8%. Ultimately, that's a low return and it under-performs the Media industry average of 9.2%.
See our latest analysis for Mission Group
Above you can see how the current ROCE for Mission Group compares to its prior returns on capital, but there's only so much you can tell from the past. If you'd like to see what analysts are forecasting going forward, you should check out our free report for Mission Group.
What Can We Tell From Mission Group's ROCE Trend?
In terms of Mission Group's historical ROCE movements, the trend isn't fantastic. Over the last five years, returns on capital have decreased to 3.8% from 7.0% five years ago. And considering revenue has dropped while employing more capital, we'd be cautious. This could mean that the business is losing its competitive advantage or market share, because while more money is being put into ventures, it's actually producing a lower return - "less bang for their buck" per se.
The Key Takeaway
We're a bit apprehensive about Mission Group because despite more capital being deployed in the business, returns on that capital and sales have both fallen. Yet despite these concerning fundamentals, the stock has performed strongly with a 66% return over the last five years, so investors appear very optimistic. Regardless, we don't feel too comfortable with the fundamentals so we'd be steering clear of this stock for now.
One more thing to note, we've identified 4 warning signs with Mission Group and understanding these should be part of your investment process.
If you want to search for solid companies with great earnings, check out this free list of companies with good balance sheets and impressive returns on equity.
If you decide to trade Mission Group, use the lowest-cost* platform that is rated #1 Overall by Barron’s, Interactive Brokers. Trade stocks, options, futures, forex, bonds and funds on 135 markets, all from a single integrated account. Promoted
New: Manage All Your Stock Portfolios in One Place
We've created the ultimate portfolio companion for stock investors, and it's free.
• Connect an unlimited number of Portfolios and see your total in one currency
• Be alerted to new Warning Signs or Risks via email or mobile
• Track the Fair Value of your stocks
This article by Simply Wall St is general in nature. It does not constitute a recommendation to buy or sell any stock, and does not take account of your objectives, or your financial situation. We aim to bring you long-term focused analysis driven by fundamental data. Note that our analysis may not factor in the latest price-sensitive company announcements or qualitative material. Simply Wall St has no position in any stocks mentioned.
*Interactive Brokers Rated Lowest Cost Broker by StockBrokers.com Annual Online Review 2020
Have feedback on this article? Concerned about the content? Get in touch with us directly. Alternatively, email editorial-team@simplywallst.com.
About AIM:TMG
Mission Group
Provides marketing and advertising related services in the United Kingdom, rest of Europe, Asia, and the United States.
Undervalued with moderate growth potential.
Market Insights


Advertisement
Community Narratives
Nike's Direct-to-Consumer Focus Will Drive Future Growth
Fair Value US$87.90|18.2% undervalued
UN
Community Contributor
Novo Nordisk will dominate GLP-1 market with Ozempic and Wegovy growth
Fair Value US$89.59|12.1% undervalued
BE
Community Contributor
Rheinmetall could get 20-25% of EU-NATO 3%-GDP defence spending
Fair Value €7.57k|82.4% undervalued
NO
Community Contributor