
Advertisement
- United Kingdom
- /
- Media
- /
- AIM:SYS1
Has System1 Group PLC's (LON:SYS1) Impressive Stock Performance Got Anything to Do With Its Fundamentals?

Most readers would already be aware that System1 Group's (LON:SYS1) stock increased significantly by 27% over the past three months. As most would know, fundamentals are what usually guide market price movements over the long-term, so we decided to look at the company's key financial indicators today to determine if they have any role to play in the recent price movement. Particularly, we will be paying attention to System1 Group's ROE today.
Return on equity or ROE is an important factor to be considered by a shareholder because it tells them how effectively their capital is being reinvested. In other words, it is a profitability ratio which measures the rate of return on the capital provided by the company's shareholders.
Check out our latest analysis for System1 Group
How Is ROE Calculated?
The formula for return on equity is:
Return on Equity = Net Profit (from continuing operations) ÷ Shareholders' Equity
So, based on the above formula, the ROE for System1 Group is:
13% = UK£1.2m ÷ UK£9.3m (Based on the trailing twelve months to September 2023).
The 'return' is the yearly profit. One way to conceptualize this is that for each £1 of shareholders' capital it has, the company made £0.13 in profit.
What Is The Relationship Between ROE And Earnings Growth?
Thus far, we have learned that ROE measures how efficiently a company is generating its profits. Based on how much of its profits the company chooses to reinvest or "retain", we are then able to evaluate a company's future ability to generate profits. Assuming everything else remains unchanged, the higher the ROE and profit retention, the higher the growth rate of a company compared to companies that don't necessarily bear these characteristics.
System1 Group's Earnings Growth And 13% ROE
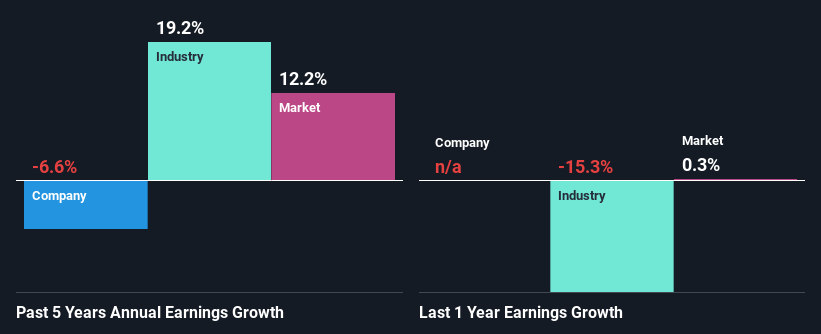
At first glance, System1 Group seems to have a decent ROE. Especially when compared to the industry average of 9.9% the company's ROE looks pretty impressive. For this reason, System1 Group's five year net income decline of 6.6% raises the question as to why the high ROE didn't translate into earnings growth. Based on this, we feel that there might be other reasons which haven't been discussed so far in this article that could be hampering the company's growth. For example, it could be that the company has a high payout ratio or the business has allocated capital poorly, for instance.
That being said, we compared System1 Group's performance with the industry and were concerned when we found that while the company has shrunk its earnings, the industry has grown its earnings at a rate of 19% in the same 5-year period.
Earnings growth is a huge factor in stock valuation. What investors need to determine next is if the expected earnings growth, or the lack of it, is already built into the share price. By doing so, they will have an idea if the stock is headed into clear blue waters or if swampy waters await. If you're wondering about System1 Group's's valuation, check out this gauge of its price-to-earnings ratio, as compared to its industry.
Is System1 Group Efficiently Re-investing Its Profits?
Because System1 Group doesn't pay any regular dividends, we infer that it is retaining all of its profits, which is rather perplexing when you consider the fact that there is no earnings growth to show for it. So there could be some other explanations in that regard. For instance, the company's business may be deteriorating.
Summary
Overall, we feel that System1 Group certainly does have some positive factors to consider. Yet, the low earnings growth is a bit concerning, especially given that the company has a high rate of return and is reinvesting ma huge portion of its profits. By the looks of it, there could be some other factors, not necessarily in control of the business, that's preventing growth. While we won't completely dismiss the company, what we would do, is try to ascertain how risky the business is to make a more informed decision around the company. You can see the 2 risks we have identified for System1 Group by visiting our risks dashboard for free on our platform here.
New: Manage All Your Stock Portfolios in One Place
We've created the ultimate portfolio companion for stock investors, and it's free.
• Connect an unlimited number of Portfolios and see your total in one currency
• Be alerted to new Warning Signs or Risks via email or mobile
• Track the Fair Value of your stocks
Have feedback on this article? Concerned about the content? Get in touch with us directly. Alternatively, email editorial-team (at) simplywallst.com.
This article by Simply Wall St is general in nature. We provide commentary based on historical data and analyst forecasts only using an unbiased methodology and our articles are not intended to be financial advice. It does not constitute a recommendation to buy or sell any stock, and does not take account of your objectives, or your financial situation. We aim to bring you long-term focused analysis driven by fundamental data. Note that our analysis may not factor in the latest price-sensitive company announcements or qualitative material. Simply Wall St has no position in any stocks mentioned.
About AIM:SYS1
System1 Group
Provides market research data and insight services in the United Kingdom, the United States, Latin America, rest of Europe, and the Asia Pacific.
Outstanding track record with flawless balance sheet.
Similar Companies
Market Insights

Advertisement
Community Narratives

BMW cruising ahead with new EVs and premium models to boost revenue 5%
Fair Value €135.07|43.3% undervalued
UN
Community Contributor
EU#2 - From Humble Beginnings to Global Powerhouse
Fair Value DKK 851.04|50.1% undervalued
TO
Community Contributor