
Advertisement
- United Kingdom
- /
- Media
- /
- AIM:EBQ
Market Cool On Ebiquity plc's (LON:EBQ) Revenues Pushing Shares 32% Lower
To the annoyance of some shareholders, Ebiquity plc (LON:EBQ) shares are down a considerable 32% in the last month, which continues a horrid run for the company. Instead of being rewarded, shareholders who have already held through the last twelve months are now sitting on a 43% share price drop.
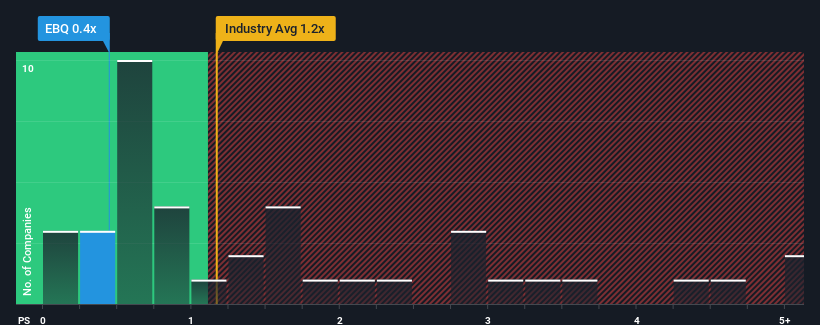
Since its price has dipped substantially, when close to half the companies operating in the United Kingdom's Media industry have price-to-sales ratios (or "P/S") above 1.2x, you may consider Ebiquity as an enticing stock to check out with its 0.4x P/S ratio. However, the P/S might be low for a reason and it requires further investigation to determine if it's justified.
See our latest analysis for Ebiquity
What Does Ebiquity's P/S Mean For Shareholders?
Recent times haven't been great for Ebiquity as its revenue has been rising slower than most other companies. Perhaps the market is expecting the current trend of poor revenue growth to continue, which has kept the P/S suppressed. If you still like the company, you'd be hoping revenue doesn't get any worse and that you could pick up some stock while it's out of favour.
If you'd like to see what analysts are forecasting going forward, you should check out our free report on Ebiquity.Do Revenue Forecasts Match The Low P/S Ratio?
There's an inherent assumption that a company should underperform the industry for P/S ratios like Ebiquity's to be considered reasonable.
Taking a look back first, we see that the company managed to grow revenues by a handy 6.8% last year. Pleasingly, revenue has also lifted 43% in aggregate from three years ago, partly thanks to the last 12 months of growth. Accordingly, shareholders would have definitely welcomed those medium-term rates of revenue growth.
Shifting to the future, estimates from the dual analysts covering the company suggest revenue growth will show minor resilience over the next three years growing only by 4.6% per year. This isn't typically strong growth, but with the rest of the industry predicted to shrink by 2.5% per year, that would be a solid result.
In light of this, it's quite peculiar that Ebiquity's P/S sits below the majority of other companies. It looks like most investors aren't convinced at all that the company can achieve positive future growth in the face of a shrinking broader industry.
The Final Word
Ebiquity's recently weak share price has pulled its P/S back below other Media companies. Generally, our preference is to limit the use of the price-to-sales ratio to establishing what the market thinks about the overall health of a company.
Our look into Ebiquity's analyst forecasts has shown that it could be trading at a significant discount in terms of P/S, as it is expected to far outperform the industry. There could be some major unobserved threats to revenue preventing the P/S ratio from matching the positive outlook. Perhaps there is some hesitation about the company's ability to keep swimming against the current of the broader industry turmoil. It appears many are indeed anticipating revenue instability, because the company's current prospects should normally provide a boost to the share price.
Before you take the next step, you should know about the 2 warning signs for Ebiquity that we have uncovered.
Of course, profitable companies with a history of great earnings growth are generally safer bets. So you may wish to see this free collection of other companies that have reasonable P/E ratios and have grown earnings strongly.
Valuation is complex, but we're here to simplify it.
Discover if Ebiquity might be undervalued or overvalued with our detailed analysis, featuring fair value estimates, potential risks, dividends, insider trades, and its financial condition.
Access Free AnalysisHave feedback on this article? Concerned about the content? Get in touch with us directly. Alternatively, email editorial-team (at) simplywallst.com.
This article by Simply Wall St is general in nature. We provide commentary based on historical data and analyst forecasts only using an unbiased methodology and our articles are not intended to be financial advice. It does not constitute a recommendation to buy or sell any stock, and does not take account of your objectives, or your financial situation. We aim to bring you long-term focused analysis driven by fundamental data. Note that our analysis may not factor in the latest price-sensitive company announcements or qualitative material. Simply Wall St has no position in any stocks mentioned.
About AIM:EBQ
Ebiquity
Provides media investment analysis services in the United Kingdom, Ireland, North America, Continental Europe, and the Asia Pacific.
Undervalued with adequate balance sheet.
Market Insights

Advertisement
Community Narratives
MicroVision will explode future revenue by 380.37% with a vision towards success
Fair Value US$60|98.4% undervalued
TH
Community Contributor
The Indispensable Artery for a New North American Economy
Fair Value CA$132.87|0.7% overvalued
TI
Community Contributor
Recently Updated Narratives
CO

composite32 on Astor Enerji ·
Astor Enerji will surge with a fair value of $140.43 in the next 3 years
Fair Value:₺140.4335.5% undervalued
1 followerusers have followed this narrative
0 commentsusers have commented on this narrative
0 likesusers have liked this narrative
RE

RecMag on Proximus ·
Proximus: The State-Backed Backup Plan with 7% Gross Yield and 15% Currency Upside.
Fair Value:€17.1356.7% undervalued
30 followersusers have followed this narrative
0 commentsusers have commented on this narrative
0 likesusers have liked this narrative
AG


Agricola on IMPACT Silver ·
A case for for IMPACT Silver Corp (TSXV:IPT) to reach USD $4.52 (CAD $6.16) in 2026 (23 bagger in 1 year) and USD $5.76 (CAD $7.89) by 2030
Fair Value:CA$7.8996.2% undervalued
1 followerusers have followed this narrative
0 commentsusers have commented on this narrative
0 likesusers have liked this narrative
Popular Narratives
TH

TheWallstreetKing on MicroVision ·
MicroVision will explode future revenue by 380.37% with a vision towards success
Fair Value:US$6098.4% undervalued
101 followersusers have followed this narrative
10 commentsusers have commented on this narrative
20 likesusers have liked this narrative
OS


oscargarcia on Alphabet ·
The company that turned a verb into a global necessity and basically runs the modern internet, digital ads, smartphones, maps, and AI.
Fair Value:US$3405.8% undervalued
138 followersusers have followed this narrative
6 commentsusers have commented on this narrative
18 likesusers have liked this narrative
AN


AnalystConsensusTarget on NVIDIA ·
NVDA: Expanding AI Demand Will Drive Major Data Center Investments Through 2026
Fair Value:US$250.3929.3% undervalued
930 followersusers have followed this narrative
6 commentsusers have commented on this narrative
23 likesusers have liked this narrative