
Advertisement

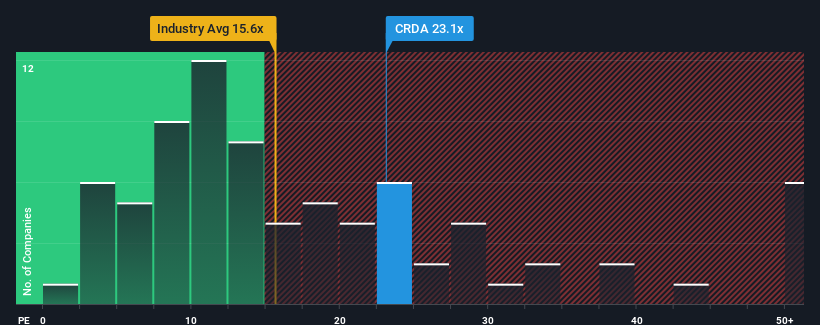
With a price-to-earnings (or "P/E") ratio of 23.1x Croda International Plc (LON:CRDA) may be sending very bearish signals at the moment, given that almost half of all companies in the United Kingdom have P/E ratios under 14x and even P/E's lower than 8x are not unusual. Although, it's not wise to just take the P/E at face value as there may be an explanation why it's so lofty.
While the market has experienced earnings growth lately, Croda International's earnings have gone into reverse gear, which is not great. It might be that many expect the dour earnings performance to recover substantially, which has kept the P/E from collapsing. You'd really hope so, otherwise you're paying a pretty hefty price for no particular reason.
See our latest analysis for Croda International
What Are Growth Metrics Telling Us About The High P/E?
In order to justify its P/E ratio, Croda International would need to produce outstanding growth well in excess of the market.
If we review the last year of earnings, dishearteningly the company's profits fell to the tune of 7.3%. The last three years don't look nice either as the company has shrunk EPS by 51% in aggregate. Therefore, it's fair to say the earnings growth recently has been undesirable for the company.
Turning to the outlook, the next three years should generate growth of 18% each year as estimated by the analysts watching the company. Meanwhile, the rest of the market is forecast to expand by 16% per annum, which is not materially different.
With this information, we find it interesting that Croda International is trading at a high P/E compared to the market. Apparently many investors in the company are more bullish than analysts indicate and aren't willing to let go of their stock right now. Although, additional gains will be difficult to achieve as this level of earnings growth is likely to weigh down the share price eventually.
The Final Word
We'd say the price-to-earnings ratio's power isn't primarily as a valuation instrument but rather to gauge current investor sentiment and future expectations.
We've established that Croda International currently trades on a higher than expected P/E since its forecast growth is only in line with the wider market. Right now we are uncomfortable with the relatively high share price as the predicted future earnings aren't likely to support such positive sentiment for long. This places shareholders' investments at risk and potential investors in danger of paying an unnecessary premium.
You should always think about risks. Case in point, we've spotted 1 warning sign for Croda International you should be aware of.
It's important to make sure you look for a great company, not just the first idea you come across. So take a peek at this free list of interesting companies with strong recent earnings growth (and a low P/E).
New: AI Stock Screener & Alerts
Our new AI Stock Screener scans the market every day to uncover opportunities.
• Dividend Powerhouses (3%+ Yield)
• Undervalued Small Caps with Insider Buying
• High growth Tech and AI Companies
Or build your own from over 50 metrics.
Have feedback on this article? Concerned about the content? Get in touch with us directly. Alternatively, email editorial-team (at) simplywallst.com.
This article by Simply Wall St is general in nature. We provide commentary based on historical data and analyst forecasts only using an unbiased methodology and our articles are not intended to be financial advice. It does not constitute a recommendation to buy or sell any stock, and does not take account of your objectives, or your financial situation. We aim to bring you long-term focused analysis driven by fundamental data. Note that our analysis may not factor in the latest price-sensitive company announcements or qualitative material. Simply Wall St has no position in any stocks mentioned.
About LSE:CRDA
Croda International
Engages in the consumer care, life science, and industrial specialty businesses in Europe, the Middle East, Africa, North America, Asia, and Latin America.
Flawless balance sheet second-rate dividend payer.
Similar Companies
Market Insights


Advertisement
Community Narratives
For the Emperor: Why Games Workshop Could Be a Star Investment
Fair Value UK£160.00|0.5% overvalued
RO
Community Contributor
Securitas will boost margins with AI and tech-driven services
Fair Value SEK 260.91|44.5% undervalued
UN
Community Contributor
A Leader in EV Charging with Growth Potential
Fair Value €27.00|18.7% undervalued
TI
Community Contributor