- United Kingdom
- /
- Metals and Mining
- /
- AIM:JLP
Jubilee Metals Group PLC's (LON:JLP) Stock On An Uptrend: Could Fundamentals Be Driving The Momentum?


Jubilee Metals Group's (LON:JLP) stock is up by a considerable 25% over the past month. Given that stock prices are usually aligned with a company's financial performance in the long-term, we decided to study its financial indicators more closely to see if they had a hand to play in the recent price move. Specifically, we decided to study Jubilee Metals Group's ROE in this article.
ROE or return on equity is a useful tool to assess how effectively a company can generate returns on the investment it received from its shareholders. In other words, it is a profitability ratio which measures the rate of return on the capital provided by the company's shareholders.
View our latest analysis for Jubilee Metals Group
How Do You Calculate Return On Equity?
Return on equity can be calculated by using the formula:
Return on Equity = Net Profit (from continuing operations) ÷ Shareholders' Equity
So, based on the above formula, the ROE for Jubilee Metals Group is:
7.3% = UK£13m ÷ UK£181m (Based on the trailing twelve months to December 2023).
The 'return' refers to a company's earnings over the last year. Another way to think of that is that for every £1 worth of equity, the company was able to earn £0.07 in profit.
What Has ROE Got To Do With Earnings Growth?
So far, we've learned that ROE is a measure of a company's profitability. Depending on how much of these profits the company reinvests or "retains", and how effectively it does so, we are then able to assess a company’s earnings growth potential. Generally speaking, other things being equal, firms with a high return on equity and profit retention, have a higher growth rate than firms that don’t share these attributes.
Jubilee Metals Group's Earnings Growth And 7.3% ROE
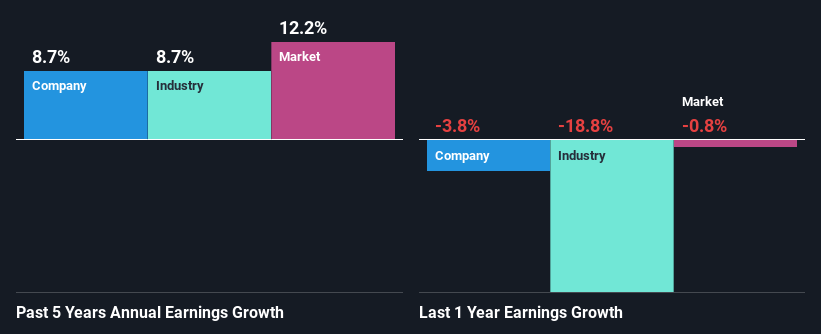
When you first look at it, Jubilee Metals Group's ROE doesn't look that attractive. However, its ROE is similar to the industry average of 8.2%, so we won't completely dismiss the company. On the other hand, Jubilee Metals Group reported a moderate 8.7% net income growth over the past five years. Given the slightly low ROE, it is likely that there could be some other aspects that are driving this growth. Such as - high earnings retention or an efficient management in place.
As a next step, we compared Jubilee Metals Group's net income growth with the industry and found that the company has a similar growth figure when compared with the industry average growth rate of 8.7% in the same period.
Earnings growth is an important metric to consider when valuing a stock. It’s important for an investor to know whether the market has priced in the company's expected earnings growth (or decline). By doing so, they will have an idea if the stock is headed into clear blue waters or if swampy waters await. One good indicator of expected earnings growth is the P/E ratio which determines the price the market is willing to pay for a stock based on its earnings prospects. So, you may want to check if Jubilee Metals Group is trading on a high P/E or a low P/E, relative to its industry.
Is Jubilee Metals Group Efficiently Re-investing Its Profits?
Given that Jubilee Metals Group doesn't pay any dividend to its shareholders, we infer that the company has been reinvesting all of its profits to grow its business.
Conclusion
In total, it does look like Jubilee Metals Group has some positive aspects to its business. With a high rate of reinvestment, albeit at a low ROE, the company has managed to see a considerable growth in its earnings. With that said, the latest industry analyst forecasts reveal that the company's earnings are expected to accelerate. To know more about the company's future earnings growth forecasts take a look at this free report on analyst forecasts for the company to find out more.
New: Manage All Your Stock Portfolios in One Place
We've created the ultimate portfolio companion for stock investors, and it's free.
• Connect an unlimited number of Portfolios and see your total in one currency
• Be alerted to new Warning Signs or Risks via email or mobile
• Track the Fair Value of your stocks
Have feedback on this article? Concerned about the content? Get in touch with us directly. Alternatively, email editorial-team (at) simplywallst.com.
This article by Simply Wall St is general in nature. We provide commentary based on historical data and analyst forecasts only using an unbiased methodology and our articles are not intended to be financial advice. It does not constitute a recommendation to buy or sell any stock, and does not take account of your objectives, or your financial situation. We aim to bring you long-term focused analysis driven by fundamental data. Note that our analysis may not factor in the latest price-sensitive company announcements or qualitative material. Simply Wall St has no position in any stocks mentioned.
About AIM:JLP
Jubilee Metals Group
Jubilee Metals Group plc operates as a diversified metals processing and recovery company.
Excellent balance sheet with reasonable growth potential.
Market Insights

Community Narratives

