Advertisement
- United Kingdom
- /
- Personal Products
- /
- LSE:ULVR
Does Unilever’s Recent Stock Slide Signal a Fresh Opportunity in 2025?

Simply Wall St
Reviewed by Bailey Pemberton
If you're standing at the crossroads with Unilever stock in your portfolio, or just wondering whether now is the time to get in, you're definitely not alone. The consumer goods giant has been caught in some choppy waters lately, with the share price dipping by 0.5% over the last week and a steeper 7.8% slide in the past month. This might look discouraging at first, but sometimes price pullbacks like this are more about shifting market sentiment than real changes in the company's long-term potential. Just remember, Unilever’s track record over the past few years is still respectable, up 24.1% over three years and 8.3% over five, which hints at underlying business strength even through near-term noise.
The recent selloff seems to reflect changing expectations around consumer staples stocks overall, rather than anything uniquely troubling for Unilever. Investors seem to be grappling with geopolitical volatility and evolving consumer behaviors, which can temporarily unsettle even the most established players. But what does all of this mean for Unilever's current valuation? That’s where things get interesting. On our six-step valuation check, Unilever scores a 2, meaning it looks undervalued according to two key criteria out of six. The big question is whether the current price offers a genuine opportunity, or if caution is still warranted.
Let’s break down those valuation methods and see how they paint the picture today. And stick around until the end, because we’ll look at an even more powerful way to think about what Unilever is really worth.
Unilever scores just 2/6 on our valuation checks. See what other red flags we found in the full valuation breakdown.
Approach 1: Unilever Discounted Cash Flow (DCF) Analysis
The Discounted Cash Flow (DCF) model is designed to estimate what a company is truly worth today by forecasting its future free cash flows and then discounting those expected streams of money back to the present. In other words, it translates tomorrow’s potential profits into today’s terms, giving investors a grounded sense of whether the current share price makes sense.
For Unilever, the latest reported Free Cash Flow stands at approximately €6.6 Billion. Analysts have projected that by 2029, Unilever’s annual free cash flow could reach about €9.0 Billion, with incremental growth further extrapolated for the next decade. While estimates from analysts extend only five years out, services like Simply Wall St continue the projections to reflect potential long-term trajectories.
Based on these discounted projections, the DCF model calculates an intrinsic value of €52.72 per share for Unilever. Compared to the current trading price, this valuation implies the stock is about 16.7% undervalued. This represents a meaningful margin that points to an opportunity if these future cash flow assumptions hold.
Result: UNDERVALUED
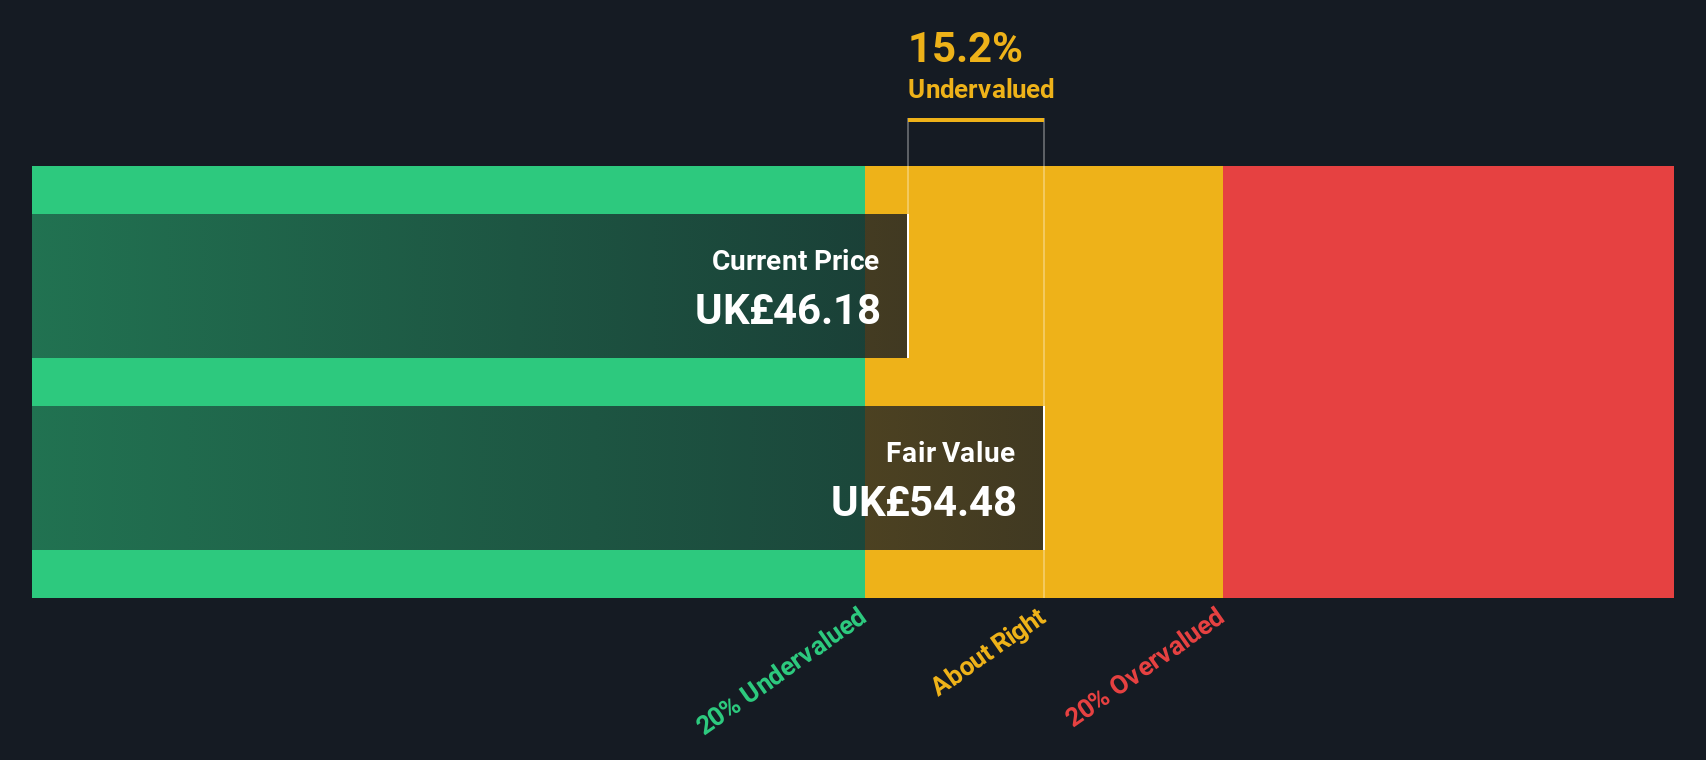
Our Discounted Cash Flow (DCF) analysis suggests Unilever is undervalued by 16.7%. Track this in your watchlist or portfolio, or discover more undervalued stocks.
Approach 2: Unilever Price vs Earnings (P/E Ratio)
The Price-to-Earnings (P/E) ratio is one of the most widely used valuation metrics for profitable companies such as Unilever. It offers a quick snapshot of how much investors are willing to pay for each pound of a company’s earnings, making it especially relevant when steady profits are in play. Generally, expectations for future growth and the perceived stability or riskiness of those earnings are what determine what is considered a “normal” or “fair” P/E ratio. Higher growth prospects or lower risk usually justify a higher multiple, while slower growth or greater uncertainty typically lead to a lower one.
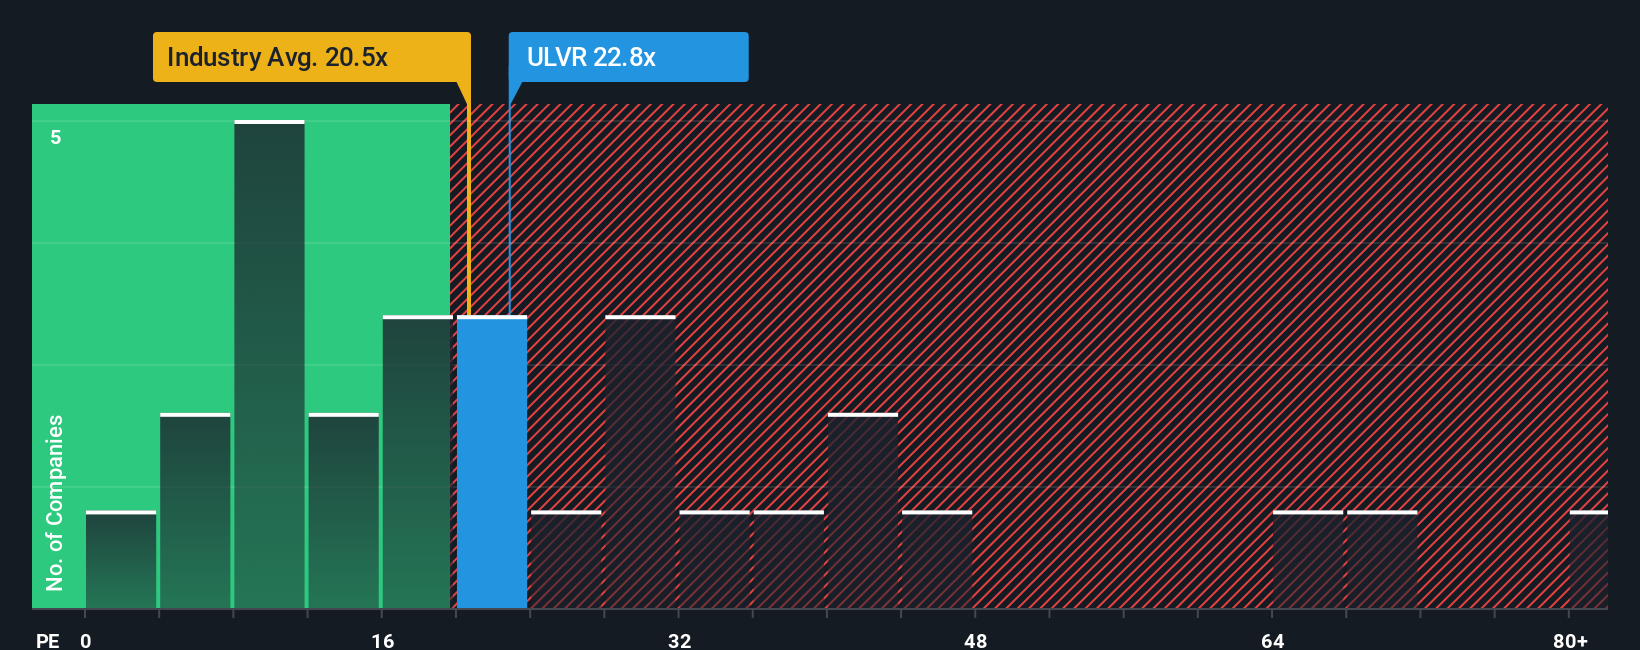
Unilever currently trades at a P/E ratio of 22.6x. This figure is in line with the personal products industry average of 22.5x and notably lower than the peer group average of 36.3x. While these basic comparisons suggest Unilever is reasonably valued relative to its market and industry, there is a more nuanced benchmark to consider: the “Fair Ratio.”
The Fair Ratio, calculated by Simply Wall St, represents the P/E multiple that best fits Unilever given its actual growth outlook, profit margins, scale, industry placement, and risk profile, rather than just how it compares to generalized competitors. Unlike simple peer or industry averages, which can miss essential details, the Fair Ratio offers a more personalized view of what is reasonable for this business today. In Unilever’s case, the Fair Ratio stands at 22.2x, which is strikingly close to the company’s current P/E. This suggests the market is pricing Unilever about right based on the factors that matter most.
Result: ABOUT RIGHT
PE ratios tell one story, but what if the real opportunity lies elsewhere? Discover companies where insiders are betting big on explosive growth.
Upgrade Your Decision Making: Choose your Unilever Narrative
Earlier we mentioned that there’s an even better way to understand valuation, so let’s introduce you to Narratives. A Narrative goes beyond just crunching numbers; it's your personal investment thesis, connecting the story of a company like Unilever to a financial forecast and a resulting fair value. With Narratives, you bring together your own assumptions about future revenue, profit margins, industry shifts, and management strategy, then see how those translate into what you believe is a justified share price.
Narratives are an easy, accessible tool available to millions of users through the Community page on Simply Wall St. They empower you to map your reasoning directly onto the numbers. They help you decide if now is the right time to buy, hold, or sell by comparing your Fair Value versus the current Price. As new information comes in, such as updated earnings or breaking news, your Narrative automatically updates so your investment view always reflects the latest reality.
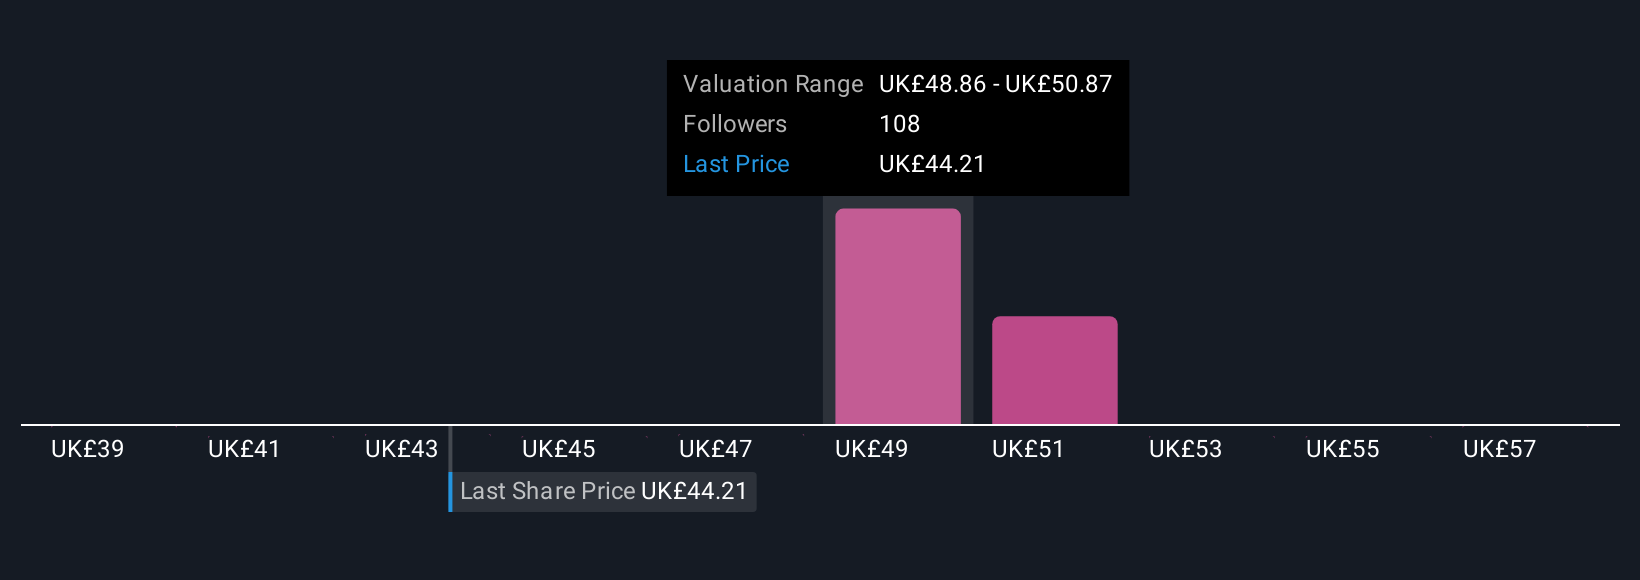
For example, Unilever’s bullish Narratives might assume rapid growth in emerging markets and successful portfolio streamlining, justifying targets as high as £59.26 per share, while bearish Narratives focus on macro risks and competitive threats, arriving at cautious targets around £38.97. This allows you to easily see where your outlook stands among a whole spectrum of investor perspectives.
Do you think there's more to the story for Unilever? Create your own Narrative to let the Community know!
This article by Simply Wall St is general in nature. We provide commentary based on historical data and analyst forecasts only using an unbiased methodology and our articles are not intended to be financial advice. It does not constitute a recommendation to buy or sell any stock, and does not take account of your objectives, or your financial situation. We aim to bring you long-term focused analysis driven by fundamental data. Note that our analysis may not factor in the latest price-sensitive company announcements or qualitative material. Simply Wall St has no position in any stocks mentioned.
New: AI Stock Screener & Alerts
Our new AI Stock Screener scans the market every day to uncover opportunities.
• Dividend Powerhouses (3%+ Yield)
• Undervalued Small Caps with Insider Buying
• High growth Tech and AI Companies
Or build your own from over 50 metrics.
Have feedback on this article? Concerned about the content? Get in touch with us directly. Alternatively, email editorial-team@simplywallst.com
About LSE:ULVR
Unilever
Operates as a fast-moving consumer goods company in the Asia Pacific, Africa, the Americas, and Europe.
Established dividend payer and slightly overvalued.
Similar Companies
Market Insights

Advertisement
Community Narratives
The Next Phase of Energy Storage: How NeoVolta Is Tackling America’s Power Crunch
Fair Value US$7.50|35.1% undervalued
MA
Community Contributor
Why EnSilica is Worth Possibly 13x its Current Price
Fair Value UK£5.00|89.8% undervalued
DO
Community Contributor
M&A Activity, Industry Diversification & A Defense Contract Monopoly Will Push BWXT For Healthy Long-Term Growth
Fair Value US$220.00|15.2% undervalued
CL
Community Contributor
A case for Cassiar Gold Corp (TSXV: GLDC) to reach CAD$8-10 before 2030 (X30-37)
Fair Value CA$10.00|96.0% undervalued
AG
Community Contributor