- United Kingdom
- /
- Personal Products
- /
- AIM:BAR
Brand Architekts Group plc's (LON:BAR) Price Is Right But Growth Is Lacking After Shares Rocket 39%


Brand Architekts Group plc (LON:BAR) shareholders would be excited to see that the share price has had a great month, posting a 39% gain and recovering from prior weakness. Unfortunately, the gains of the last month did little to right the losses of the last year with the stock still down 12% over that time.
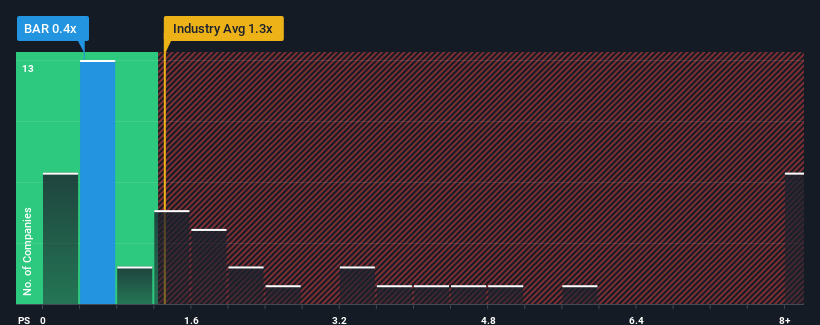
Even after such a large jump in price, Brand Architekts Group may still be sending bullish signals at the moment with its price-to-sales (or "P/S") ratio of 0.4x, since almost half of all companies in the Personal Products industry in the United Kingdom have P/S ratios greater than 1.9x and even P/S higher than 4x are not unusual. However, the P/S might be low for a reason and it requires further investigation to determine if it's justified.
See our latest analysis for Brand Architekts Group
What Does Brand Architekts Group's P/S Mean For Shareholders?
With revenue growth that's superior to most other companies of late, Brand Architekts Group has been doing relatively well. It might be that many expect the strong revenue performance to degrade substantially, which has repressed the share price, and thus the P/S ratio. If not, then existing shareholders have reason to be quite optimistic about the future direction of the share price.
Keen to find out how analysts think Brand Architekts Group's future stacks up against the industry? In that case, our free report is a great place to start.What Are Revenue Growth Metrics Telling Us About The Low P/S?
The only time you'd be truly comfortable seeing a P/S as low as Brand Architekts Group's is when the company's growth is on track to lag the industry.
Taking a look back first, we see that the company managed to grow revenues by a handy 3.2% last year. The solid recent performance means it was also able to grow revenue by 23% in total over the last three years. Accordingly, shareholders would have probably been satisfied with the medium-term rates of revenue growth.
Shifting to the future, estimates from the one analyst covering the company suggest revenue growth is heading into negative territory, declining 0.5% over the next year. With the industry predicted to deliver 1.7% growth, that's a disappointing outcome.
With this information, we are not surprised that Brand Architekts Group is trading at a P/S lower than the industry. Nonetheless, there's no guarantee the P/S has reached a floor yet with revenue going in reverse. There's potential for the P/S to fall to even lower levels if the company doesn't improve its top-line growth.
What Does Brand Architekts Group's P/S Mean For Investors?
Brand Architekts Group's stock price has surged recently, but its but its P/S still remains modest. Using the price-to-sales ratio alone to determine if you should sell your stock isn't sensible, however it can be a practical guide to the company's future prospects.
It's clear to see that Brand Architekts Group maintains its low P/S on the weakness of its forecast for sliding revenue, as expected. At this stage investors feel the potential for an improvement in revenue isn't great enough to justify a higher P/S ratio. Unless there's material change, it's hard to envision a situation where the stock price will rise drastically.
Plus, you should also learn about these 3 warning signs we've spotted with Brand Architekts Group (including 2 which are potentially serious).
Of course, profitable companies with a history of great earnings growth are generally safer bets. So you may wish to see this free collection of other companies that have reasonable P/E ratios and have grown earnings strongly.
If you're looking to trade Brand Architekts Group, open an account with the lowest-cost platform trusted by professionals, Interactive Brokers.
With clients in over 200 countries and territories, and access to 160 markets, IBKR lets you trade stocks, options, futures, forex, bonds and funds from a single integrated account.
Enjoy no hidden fees, no account minimums, and FX conversion rates as low as 0.03%, far better than what most brokers offer.
Sponsored ContentValuation is complex, but we're here to simplify it.
Discover if Brand Architekts Group might be undervalued or overvalued with our detailed analysis, featuring fair value estimates, potential risks, dividends, insider trades, and its financial condition.
Access Free AnalysisHave feedback on this article? Concerned about the content? Get in touch with us directly. Alternatively, email editorial-team (at) simplywallst.com.
This article by Simply Wall St is general in nature. We provide commentary based on historical data and analyst forecasts only using an unbiased methodology and our articles are not intended to be financial advice. It does not constitute a recommendation to buy or sell any stock, and does not take account of your objectives, or your financial situation. We aim to bring you long-term focused analysis driven by fundamental data. Note that our analysis may not factor in the latest price-sensitive company announcements or qualitative material. Simply Wall St has no position in any stocks mentioned.
About AIM:BAR
Brand Architekts Group
Operates in the beauty sector in the United Kingdom, other European Union countries, and internationally.
Flawless balance sheet low.

