- United Kingdom
- /
- Medical Equipment
- /
- AIM:MHC
MyHealthChecked PLC (LON:MHC) Soars 31% But It's A Story Of Risk Vs Reward


MyHealthChecked PLC (LON:MHC) shares have had a really impressive month, gaining 31% after a shaky period beforehand. Looking further back, the 15% rise over the last twelve months isn't too bad notwithstanding the strength over the last 30 days.
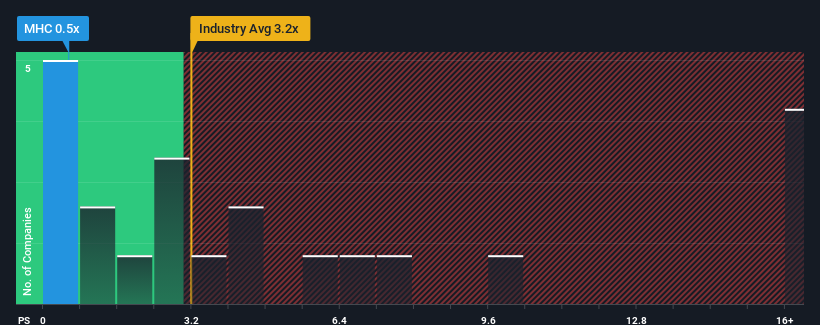
Even after such a large jump in price, MyHealthChecked's price-to-sales (or "P/S") ratio of 0.5x might still make it look like a strong buy right now compared to the wider Medical Equipment industry in the United Kingdom, where around half of the companies have P/S ratios above 3.2x and even P/S above 9x are quite common. Although, it's not wise to just take the P/S at face value as there may be an explanation why it's so limited.
Check out our latest analysis for MyHealthChecked
What Does MyHealthChecked's P/S Mean For Shareholders?
For example, consider that MyHealthChecked's financial performance has been poor lately as its revenue has been in decline. One possibility is that the P/S is low because investors think the company won't do enough to avoid underperforming the broader industry in the near future. Those who are bullish on MyHealthChecked will be hoping that this isn't the case so that they can pick up the stock at a lower valuation.
We don't have analyst forecasts, but you can see how recent trends are setting up the company for the future by checking out our free report on MyHealthChecked's earnings, revenue and cash flow.Is There Any Revenue Growth Forecasted For MyHealthChecked?
There's an inherent assumption that a company should far underperform the industry for P/S ratios like MyHealthChecked's to be considered reasonable.
Taking a look back first, the company's revenue growth last year wasn't something to get excited about as it posted a disappointing decline of 51%. Spectacularly, three year revenue growth has ballooned by several orders of magnitude, despite the drawbacks experienced in the last 12 months. Therefore, it's fair to say the revenue growth recently has been superb for the company, but investors will want to ask why it is now in decline.
This is in contrast to the rest of the industry, which is expected to grow by 10% over the next year, materially lower than the company's recent medium-term annualised growth rates.
With this in mind, we find it intriguing that MyHealthChecked's P/S isn't as high compared to that of its industry peers. Apparently some shareholders believe the recent performance has exceeded its limits and have been accepting significantly lower selling prices.
The Key Takeaway
MyHealthChecked's recent share price jump still sees fails to bring its P/S alongside the industry median. Typically, we'd caution against reading too much into price-to-sales ratios when settling on investment decisions, though it can reveal plenty about what other market participants think about the company.
We're very surprised to see MyHealthChecked currently trading on a much lower than expected P/S since its recent three-year growth is higher than the wider industry forecast. When we see strong revenue with faster-than-industry growth, we assume there are some significant underlying risks to the company's ability to make money which is applying downwards pressure on the P/S ratio. It appears many are indeed anticipating revenue instability, because the persistence of these recent medium-term conditions would normally provide a boost to the share price.
Plus, you should also learn about these 2 warning signs we've spotted with MyHealthChecked (including 1 which makes us a bit uncomfortable).
If you're unsure about the strength of MyHealthChecked's business, why not explore our interactive list of stocks with solid business fundamentals for some other companies you may have missed.
New: Manage All Your Stock Portfolios in One Place
We've created the ultimate portfolio companion for stock investors, and it's free.
• Connect an unlimited number of Portfolios and see your total in one currency
• Be alerted to new Warning Signs or Risks via email or mobile
• Track the Fair Value of your stocks
Have feedback on this article? Concerned about the content? Get in touch with us directly. Alternatively, email editorial-team (at) simplywallst.com.
This article by Simply Wall St is general in nature. We provide commentary based on historical data and analyst forecasts only using an unbiased methodology and our articles are not intended to be financial advice. It does not constitute a recommendation to buy or sell any stock, and does not take account of your objectives, or your financial situation. We aim to bring you long-term focused analysis driven by fundamental data. Note that our analysis may not factor in the latest price-sensitive company announcements or qualitative material. Simply Wall St has no position in any stocks mentioned.
About AIM:MHC
MyHealthChecked
Develops, distributes, and commercializes at-home healthcare and wellness tests in the United Kingdom.
Adequate balance sheet and slightly overvalued.
Market Insights

Community Narratives

