
Some say volatility, rather than debt, is the best way to think about risk as an investor, but Warren Buffett famously said that 'Volatility is far from synonymous with risk.' When we think about how risky a company is, we always like to look at its use of debt, since debt overload can lead to ruin. We note that CVS Group plc (LON:CVSG) does have debt on its balance sheet. But should shareholders be worried about its use of debt?
What Risk Does Debt Bring?
Debt and other liabilities become risky for a business when it cannot easily fulfill those obligations, either with free cash flow or by raising capital at an attractive price. In the worst case scenario, a company can go bankrupt if it cannot pay its creditors. However, a more usual (but still expensive) situation is where a company must dilute shareholders at a cheap share price simply to get debt under control. Of course, plenty of companies use debt to fund growth, without any negative consequences. When we examine debt levels, we first consider both cash and debt levels, together.
See our latest analysis for CVS Group
How Much Debt Does CVS Group Carry?
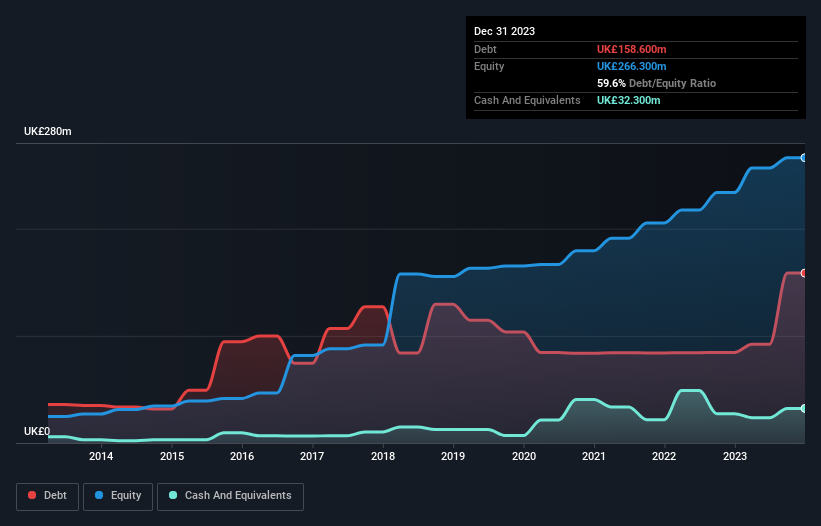
You can click the graphic below for the historical numbers, but it shows that as of December 2023 CVS Group had UK£158.6m of debt, an increase on UK£84.5m, over one year. However, it also had UK£32.3m in cash, and so its net debt is UK£126.3m.
How Healthy Is CVS Group's Balance Sheet?
We can see from the most recent balance sheet that CVS Group had liabilities of UK£106.0m falling due within a year, and liabilities of UK£288.5m due beyond that. On the other hand, it had cash of UK£32.3m and UK£61.0m worth of receivables due within a year. So its liabilities total UK£301.2m more than the combination of its cash and short-term receivables.
CVS Group has a market capitalization of UK£730.7m, so it could very likely raise cash to ameliorate its balance sheet, if the need arose. But it's clear that we should definitely closely examine whether it can manage its debt without dilution.
We measure a company's debt load relative to its earnings power by looking at its net debt divided by its earnings before interest, tax, depreciation, and amortization (EBITDA) and by calculating how easily its earnings before interest and tax (EBIT) cover its interest expense (interest cover). Thus we consider debt relative to earnings both with and without depreciation and amortization expenses.
While CVS Group's low debt to EBITDA ratio of 1.3 suggests only modest use of debt, the fact that EBIT only covered the interest expense by 5.9 times last year does give us pause. So we'd recommend keeping a close eye on the impact financing costs are having on the business. We note that CVS Group grew its EBIT by 24% in the last year, and that should make it easier to pay down debt, going forward. There's no doubt that we learn most about debt from the balance sheet. But it is future earnings, more than anything, that will determine CVS Group's ability to maintain a healthy balance sheet going forward. So if you're focused on the future you can check out this free report showing analyst profit forecasts.
Finally, a business needs free cash flow to pay off debt; accounting profits just don't cut it. So the logical step is to look at the proportion of that EBIT that is matched by actual free cash flow. During the last three years, CVS Group produced sturdy free cash flow equating to 77% of its EBIT, about what we'd expect. This cold hard cash means it can reduce its debt when it wants to.
Our View
Happily, CVS Group's impressive conversion of EBIT to free cash flow implies it has the upper hand on its debt. And the good news does not stop there, as its EBIT growth rate also supports that impression! We would also note that Healthcare industry companies like CVS Group commonly do use debt without problems. Looking at the bigger picture, we think CVS Group's use of debt seems quite reasonable and we're not concerned about it. After all, sensible leverage can boost returns on equity. There's no doubt that we learn most about debt from the balance sheet. However, not all investment risk resides within the balance sheet - far from it. Be aware that CVS Group is showing 2 warning signs in our investment analysis , you should know about...
At the end of the day, it's often better to focus on companies that are free from net debt. You can access our special list of such companies (all with a track record of profit growth). It's free.
The New Payments ETF Is Live on NASDAQ:
Money is moving to real-time rails, and a newly listed ETF now gives investors direct exposure. Fast settlement. Institutional custody. Simple access.
Explore how this launch could reshape portfolios
Sponsored ContentNew: AI Stock Screener & Alerts
Our new AI Stock Screener scans the market every day to uncover opportunities.
• Dividend Powerhouses (3%+ Yield)
• Undervalued Small Caps with Insider Buying
• High growth Tech and AI Companies
Or build your own from over 50 metrics.
Have feedback on this article? Concerned about the content? Get in touch with us directly. Alternatively, email editorial-team (at) simplywallst.com.
This article by Simply Wall St is general in nature. We provide commentary based on historical data and analyst forecasts only using an unbiased methodology and our articles are not intended to be financial advice. It does not constitute a recommendation to buy or sell any stock, and does not take account of your objectives, or your financial situation. We aim to bring you long-term focused analysis driven by fundamental data. Note that our analysis may not factor in the latest price-sensitive company announcements or qualitative material. Simply Wall St has no position in any stocks mentioned.
About AIM:CVSG
CVS Group
Engages in veterinary, online pharmacy, and retail businesses in the United Kingdom and Australia.
Fair value with moderate growth potential.
Market Insights

Weekly Picks

Early mover in a fast growing industry. Likely to experience share price volatility as they scale


A case for CA$31.80 (undiluted), aka 8,616% upside from CA$0.37 (an 86 bagger!).


Moderation and Stabilisation: HOLD: Fair Price based on a 4-year Cycle is $12.08
Recently Updated Narratives


Title: Market Sentiment Is Dead Wrong — Here's Why PSEC Deserves a Second Look


An amazing opportunity to potentially get a 100 bagger

Amazon: Why the World’s Biggest Platform Still Runs on Invisible Economics
Popular Narratives


Crazy Undervalued 42 Baggers Silver Play (Active & Running Mine)


MicroVision will explode future revenue by 380.37% with a vision towards success


NVDA: Expanding AI Demand Will Drive Major Data Center Investments Through 2026
Trending Discussion
