
Advertisement
- United Kingdom
- /
- Oil and Gas
- /
- LSE:DEC
Even With A 26% Surge, Cautious Investors Are Not Rewarding Diversified Energy Company PLC's (LON:DEC) Performance Completely
Diversified Energy Company PLC (LON:DEC) shares have had a really impressive month, gaining 26% after a shaky period beforehand. Not all shareholders will be feeling jubilant, since the share price is still down a very disappointing 41% in the last twelve months.
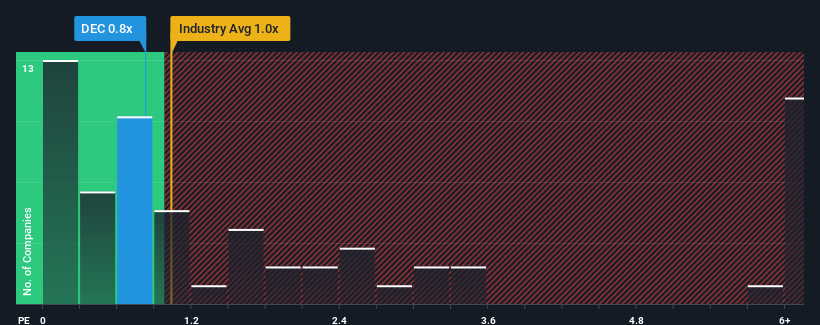
Even after such a large jump in price, it's still not a stretch to say that Diversified Energy's price-to-sales (or "P/S") ratio of 0.8x right now seems quite "middle-of-the-road" compared to the Oil and Gas industry in the United Kingdom, where the median P/S ratio is around 1x. Although, it's not wise to simply ignore the P/S without explanation as investors may be disregarding a distinct opportunity or a costly mistake.
View our latest analysis for Diversified Energy
How Has Diversified Energy Performed Recently?
Recent times haven't been great for Diversified Energy as its revenue has been falling quicker than most other companies. It might be that many expect the dismal revenue performance to revert back to industry averages soon, which has kept the P/S from falling. If you still like the company, you'd want its revenue trajectory to turn around before making any decisions. If not, then existing shareholders may be a little nervous about the viability of the share price.
Want the full picture on analyst estimates for the company? Then our free report on Diversified Energy will help you uncover what's on the horizon.How Is Diversified Energy's Revenue Growth Trending?
Diversified Energy's P/S ratio would be typical for a company that's only expected to deliver moderate growth, and importantly, perform in line with the industry.
Retrospectively, the last year delivered a frustrating 56% decrease to the company's top line. Even so, admirably revenue has lifted 97% in aggregate from three years ago, notwithstanding the last 12 months. Accordingly, while they would have preferred to keep the run going, shareholders would definitely welcome the medium-term rates of revenue growth.
Shifting to the future, estimates from the three analysts covering the company suggest revenue growth will be highly resilient over the next three years growing by 12% each year. With the rest of the industry predicted to shrink by 0.6% per annum, that would be a fantastic result.
In light of this, it's peculiar that Diversified Energy's P/S sits in-line with the majority of other companies. Apparently some shareholders are skeptical of the contrarian forecasts and have been accepting lower selling prices.
The Bottom Line On Diversified Energy's P/S
Diversified Energy appears to be back in favour with a solid price jump bringing its P/S back in line with other companies in the industry While the price-to-sales ratio shouldn't be the defining factor in whether you buy a stock or not, it's quite a capable barometer of revenue expectations.
We note that even though Diversified Energy trades at a similar P/S as the rest of the industry, it far eclipses them in terms of forecasted revenue growth. There could be some unobserved threats to revenue preventing the P/S ratio from matching the positive outlook. The market could be pricing in the event that tough industry conditions will impact future revenues. At least the risk of a price drop looks to be subdued, but investors seem to think future revenue could see some volatility.
There are also other vital risk factors to consider and we've discovered 4 warning signs for Diversified Energy (2 are a bit concerning!) that you should be aware of before investing here.
If these risks are making you reconsider your opinion on Diversified Energy, explore our interactive list of high quality stocks to get an idea of what else is out there.
New: Manage All Your Stock Portfolios in One Place
We've created the ultimate portfolio companion for stock investors, and it's free.
• Connect an unlimited number of Portfolios and see your total in one currency
• Be alerted to new Warning Signs or Risks via email or mobile
• Track the Fair Value of your stocks
Have feedback on this article? Concerned about the content? Get in touch with us directly. Alternatively, email editorial-team (at) simplywallst.com.
This article by Simply Wall St is general in nature. We provide commentary based on historical data and analyst forecasts only using an unbiased methodology and our articles are not intended to be financial advice. It does not constitute a recommendation to buy or sell any stock, and does not take account of your objectives, or your financial situation. We aim to bring you long-term focused analysis driven by fundamental data. Note that our analysis may not factor in the latest price-sensitive company announcements or qualitative material. Simply Wall St has no position in any stocks mentioned.
About LSE:DEC
Diversified Energy
An independent energy company, focuses on the production, transportation, and marketing of natural gas and liquids primarily in the Appalachian and Central regions of the United States.
Undervalued with high growth potential.
Similar Companies
Market Insights

Advertisement
Community Narratives
MicroVision will explode future revenue by 380.37% with a vision towards success
Fair Value US$60|98.4% undervalued
TH
Community Contributor
The Indispensable Artery for a New North American Economy
Fair Value CA$132.87|0.6% undervalued
TI
Community Contributor
Recently Updated Narratives
BL


BlackGoat on Alphabet ·
Alphabet: The Under-appreciated Compounder Hiding in Plain Sight
Fair Value:US$324.481.3% undervalued
75 followersusers have followed this narrative
3 commentsusers have commented on this narrative
1 likeusers have liked this narrative
BE


Bejgal on MINISO Group Holding ·
MINISO's fair value is projected at 26.69 with an anticipated PE ratio shift of 20x
Fair Value:US$26.6926.7% undervalued
44 followersusers have followed this narrative
3 commentsusers have commented on this narrative
0 likesusers have liked this narrative
TI


TickerTickle on Oracle ·
The Quiet Giant That Became AI’s Power Grid
Fair Value:US$389.8147.4% undervalued
9 followersusers have followed this narrative
1 commentusers have commented on this narrative
0 likesusers have liked this narrative
Popular Narratives
OS

oscargarcia on Alphabet ·
The company that turned a verb into a global necessity and basically runs the modern internet, digital ads, smartphones, maps, and AI.
Fair Value:US$3405.9% undervalued
136 followersusers have followed this narrative
6 commentsusers have commented on this narrative
18 likesusers have liked this narrative
TH

TheWallstreetKing on MicroVision ·
MicroVision will explode future revenue by 380.37% with a vision towards success
Fair Value:US$6098.4% undervalued
89 followersusers have followed this narrative
11 commentsusers have commented on this narrative
18 likesusers have liked this narrative
AN


AnalystConsensusTarget on NVIDIA ·
NVDA: Expanding AI Demand Will Drive Major Data Center Investments Through 2026
Fair Value:US$232.7922.6% undervalued
926 followersusers have followed this narrative
6 commentsusers have commented on this narrative
22 likesusers have liked this narrative