Advertisement
- United Kingdom
- /
- Oil and Gas
- /
- LSE:BP.
Is BP’s Recent Price Dip an Opportunity After Wells Fargo’s New Rating?

Simply Wall St
Reviewed by Bailey Pemberton
Thinking about what to do with BP stock right now? You are not alone. Investors everywhere are wrestling with whether BP’s recent price wobbles signal a real long-term opportunity or just raise more questions. The stock gave back 2.2% last week and is slightly down over the last 30 days. But here is the key point: over the last five years, BP has delivered a 158.1% return, outpacing expectations and leaving many skeptical investors reconsidering their decisions to sit on the sidelines.
Much of this story is closely connected to what is happening in the global oil markets. OPEC+ has been shifting strategy, agreeing to gradually increase output, while demand projections remain steady. Despite public fears over oil and energy stocks, some analysts argue this climate could actually present overlooked upside. Wells Fargo, for example, recently initiated BP with an "Equal Weight" rating and a bullish price target. There is also the activist perspective to consider, with Elliott pushing for stronger cost controls and smarter capital allocation. All of this means there is a lot more going on beneath the surface than short-term moves may suggest.
When it comes to valuation, BP is currently undervalued in five out of six key checks, which gives it a solid value score of 5. But what does that number really mean, and how should you weigh it against real-world events and stock moves? Let’s break down the key valuation approaches used to assess BP’s worth, before revealing a potentially better way to think about value in this market.
Why BP is lagging behind its peers
Approach 1: BP Discounted Cash Flow (DCF) Analysis
The Discounted Cash Flow (DCF) model estimates BP’s intrinsic value by projecting its future free cash flows and discounting those projected amounts back to today's value. This approach aims to reflect what BP is truly worth based on its capacity to generate cash in the years ahead.
BP’s current last twelve months Free Cash Flow stands at approximately $10.3 Billion. Analyst forecasts for the next five years see this figure rising steadily, with projections reaching as high as $11.98 Billion by 2029. These medium-term projections are then extended by extrapolating trends for another five years, resulting in future estimates that top $13.2 Billion by 2035 according to Simply Wall St’s methodology.
Plugging these numbers into the DCF framework, the fair value per share is calculated at $9.22. At current market levels, this equates to BP trading at a 55.4% discount to its estimated intrinsic value, which is a substantial margin by any measure.
Bottom line: DCF analysis suggests BP stock is significantly undervalued relative to its cash-generating potential.
Result: UNDERVALUED
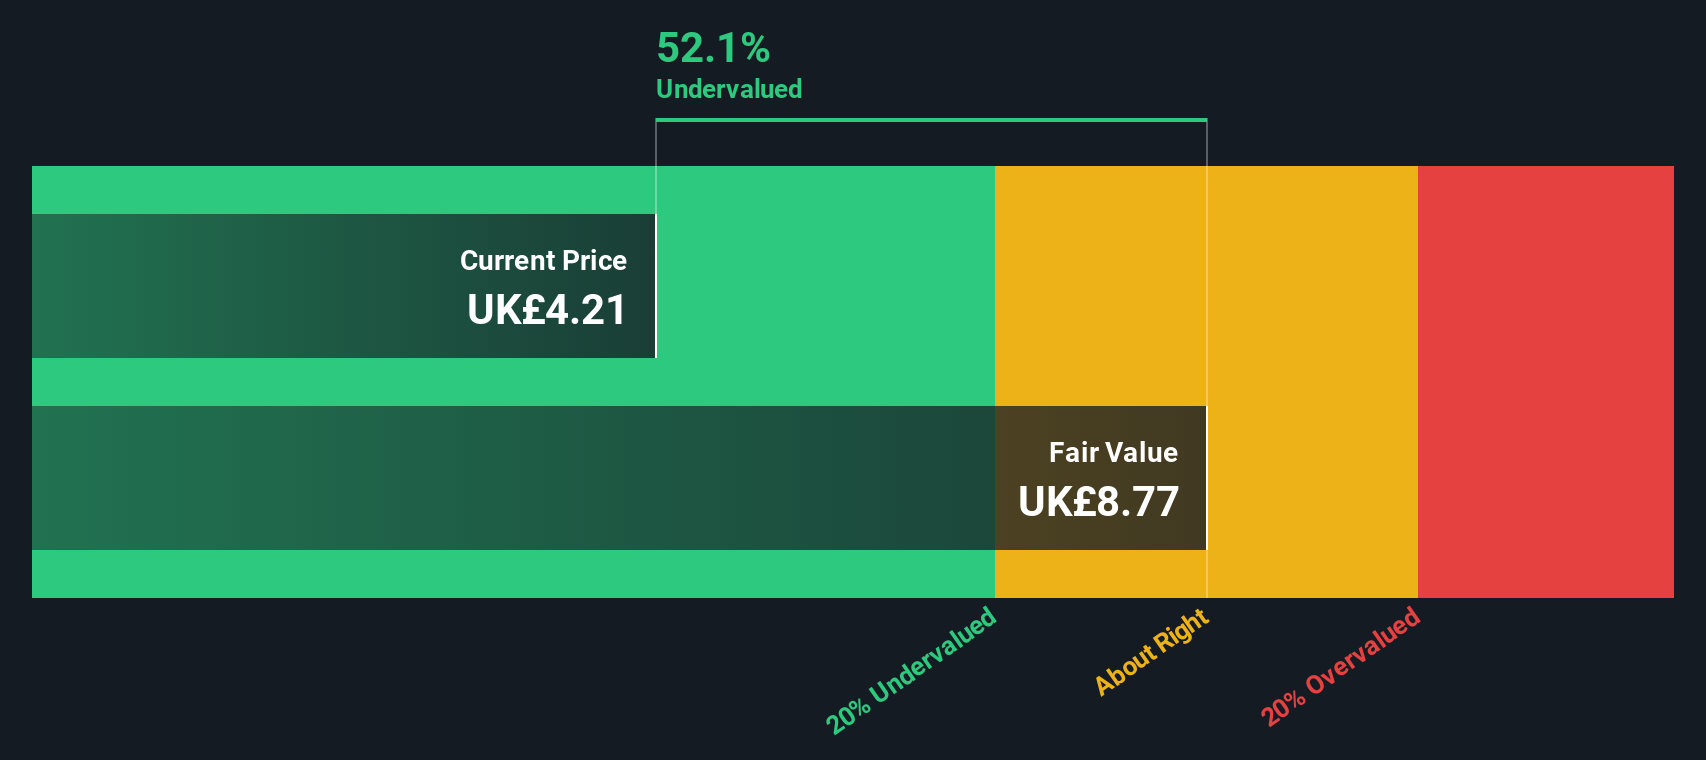
Our Discounted Cash Flow (DCF) analysis suggests BP is undervalued by 55.4%. Track this in your watchlist or portfolio, or discover more undervalued stocks.
Approach 2: BP Price vs Sales
For profitable companies like BP, the Price-to-Sales (PS) multiple is a widely used way to assess valuation because it relates a company’s market value to its actual revenue generation. This provides investors with a quick way to compare sales efficiency across companies, regardless of short-term earnings swings that can sometimes make it harder to evaluate energy firms.
What counts as a “normal” PS ratio depends on the company’s growth prospects and risk profile. Higher growth and lower risk typically justify a higher ratio, while slower-growing or riskier businesses tend to trade at a discount to the sector.
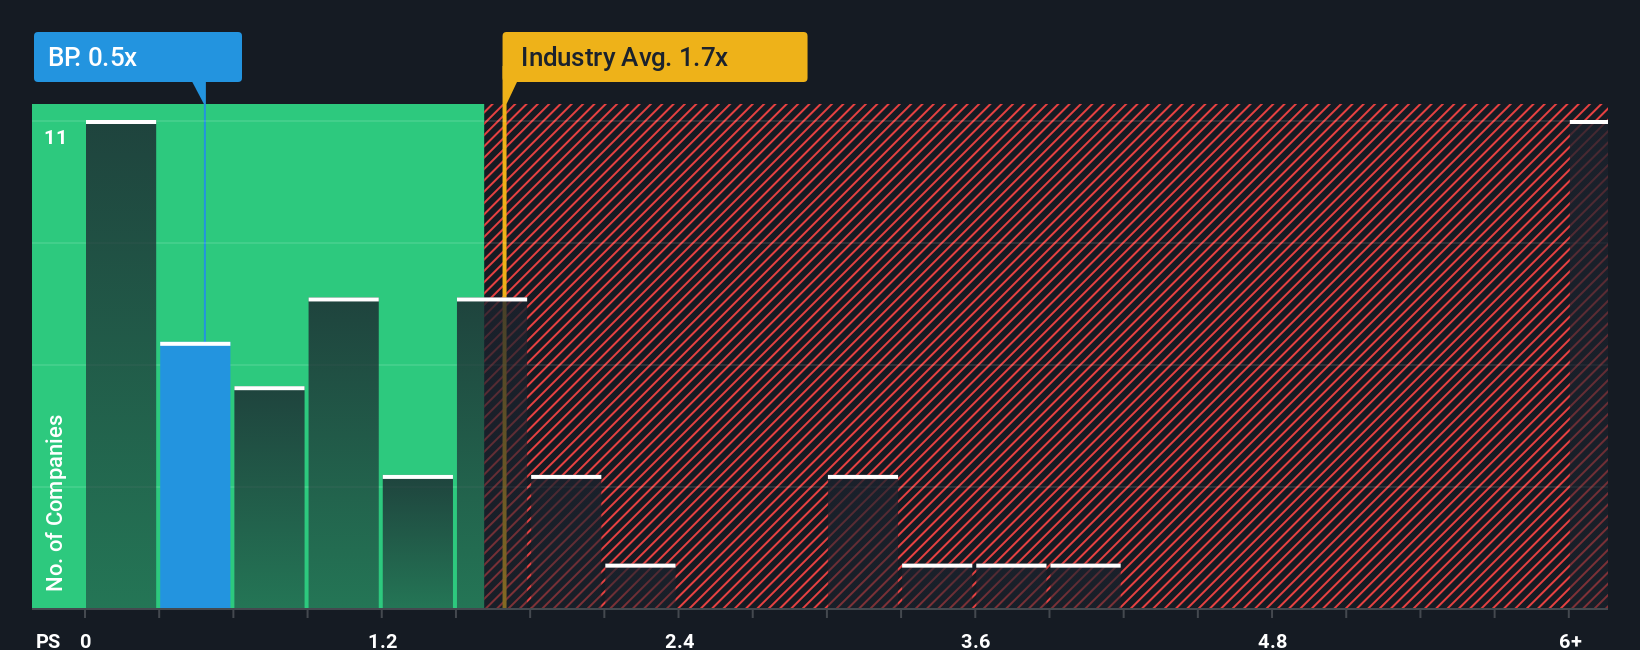
BP's current PS ratio stands at 0.46x. For perspective, the Oil and Gas industry average sits at 1.64x, and BP’s peer group trades at an even higher average of 1.78x. This indicates that BP’s shares trade well below where the average oil and gas name typically sits.
However, peer and industry averages can miss the unique mix of factors shaping a company’s true fair value. That is where the Simply Wall St “Fair Ratio” comes in, a proprietary metric that reflects not just sector and peer benchmarks but also incorporates BP’s growth, risk, profit margins, industry classification, and market cap into one tailored valuation anchor. This offers a more refined starting point for setting value expectations, especially in a sector like energy where company fundamentals can diverge sharply.
In BP’s case, the Fair Ratio is calculated at 1.32x, nearly triple its current PS ratio. Since BP trades well below this level, it points to the stock being undervalued by this measure.
Result: UNDERVALUED
PS ratios tell one story, but what if the real opportunity lies elsewhere? Discover companies where insiders are betting big on explosive growth.
Upgrade Your Decision Making: Choose your BP Narrative
Earlier we mentioned that there is an even better way to understand valuation, so let’s introduce you to Narratives. A Narrative is essentially your story or perspective about a company’s future, combining your assumptions for BP’s revenue growth, earnings, and margins into a financial forecast that leads directly to your estimate of fair value.
Unlike static ratios or models, Narratives connect the dots between what you believe about BP’s future and what that means for its share price. Narratives are available within the Simply Wall St Community page, used by millions of investors, and are designed to be both simple to create and easy to update as new information arrives, such as news events or company earnings reports.
With Narratives, you can instantly see whether your calculated Fair Value is higher or lower than BP’s current share price, helping clarify if it is time to buy, hold, or sell. Importantly, Narratives can be updated dynamically as fresh news or results come in, keeping your view relevant and up to date.
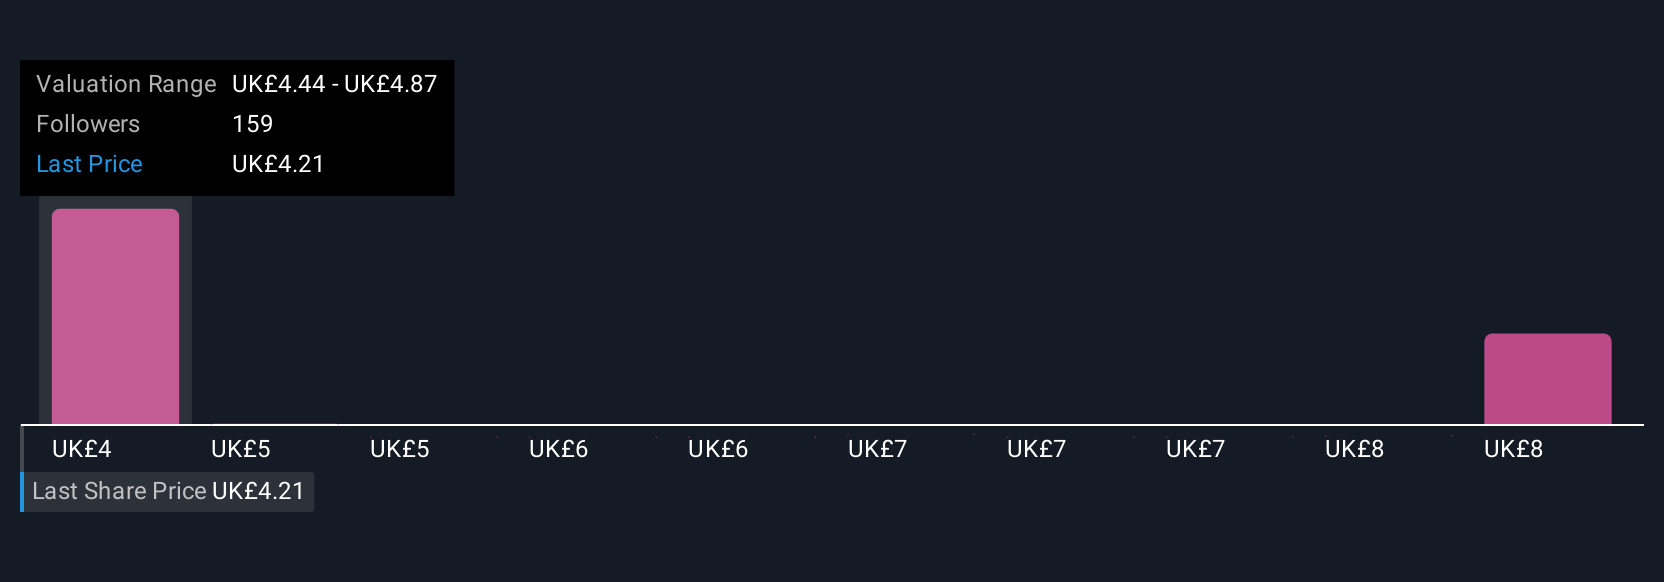
For example, some investors in the BP Community currently have a bullish Narrative with a Fair Value above £5.20, forecasting strong revenue and margin growth, while others are more cautious, assigning fair values around £3.82 based on slower growth and higher risks. Narratives make it easy to compare, learn, and act on what matters most to you.
Do you think there's more to the story for BP? Create your own Narrative to let the Community know!
This article by Simply Wall St is general in nature. We provide commentary based on historical data and analyst forecasts only using an unbiased methodology and our articles are not intended to be financial advice. It does not constitute a recommendation to buy or sell any stock, and does not take account of your objectives, or your financial situation. We aim to bring you long-term focused analysis driven by fundamental data. Note that our analysis may not factor in the latest price-sensitive company announcements or qualitative material. Simply Wall St has no position in any stocks mentioned.
Valuation is complex, but we're here to simplify it.
Discover if BP might be undervalued or overvalued with our detailed analysis, featuring fair value estimates, potential risks, dividends, insider trades, and its financial condition.
Access Free AnalysisHave feedback on this article? Concerned about the content? Get in touch with us directly. Alternatively, email editorial-team@simplywallst.com
About LSE:BP.
Undervalued with excellent balance sheet.
Similar Companies
Market Insights

Advertisement
Community Narratives
Kodiak AI - a potential 100 bagger opportunity?
Fair Value US$14.00|44.7% undervalued
DA
Community Contributor
A Fair Price for a Great Business Facing Real Threats
Fair Value US$383.06|13.0% undervalued
IM
Community Contributor
AXON And Shopify Integration Will Unlock Global Mobile Advertising
Fair Value US$646.30|0% overvalued
AN
Based on Analyst Price Targets