- United Kingdom
- /
- Oil and Gas
- /
- AIM:STAR
Star Energy Group Plc's (LON:STAR) Shares Bounce 33% But Its Business Still Trails The Industry


Star Energy Group Plc (LON:STAR) shareholders have had their patience rewarded with a 33% share price jump in the last month. Unfortunately, the gains of the last month did little to right the losses of the last year with the stock still down 39% over that time.
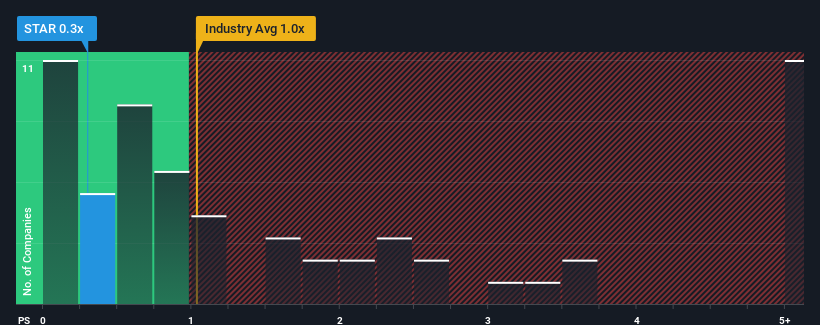
Even after such a large jump in price, Star Energy Group may still be sending buy signals at present with its price-to-sales (or "P/S") ratio of 0.3x, considering almost half of all companies in the Oil and Gas industry in the United Kingdom have P/S ratios greater than 1x and even P/S higher than 4x aren't out of the ordinary. Nonetheless, we'd need to dig a little deeper to determine if there is a rational basis for the reduced P/S.
See our latest analysis for Star Energy Group
What Does Star Energy Group's P/S Mean For Shareholders?
There hasn't been much to differentiate Star Energy Group's and the industry's retreating revenue lately. One possibility is that the P/S ratio is low because investors think the company's revenue may begin to slide even faster. You'd much rather the company continue improving its revenue if you still believe in the business. In saying that, existing shareholders may feel hopeful about the share price if the company's revenue continues tracking the industry.
Keen to find out how analysts think Star Energy Group's future stacks up against the industry? In that case, our free report is a great place to start.Is There Any Revenue Growth Forecasted For Star Energy Group?
The only time you'd be truly comfortable seeing a P/S as low as Star Energy Group's is when the company's growth is on track to lag the industry.
Retrospectively, the last year delivered a frustrating 16% decrease to the company's top line. Still, the latest three year period has seen an excellent 129% overall rise in revenue, in spite of its unsatisfying short-term performance. Accordingly, while they would have preferred to keep the run going, shareholders would definitely welcome the medium-term rates of revenue growth.
Looking ahead now, revenue is anticipated to plummet, contracting by 4.0% each year during the coming three years according to the two analysts following the company. The industry is also set to see revenue decline 0.6% each year but the stock is shaping up to perform materially worse.
With this information, it's not too hard to see why Star Energy Group is trading at a lower P/S in comparison. Nonetheless, with revenue going quickly in reverse, it's not guaranteed that the P/S has found a floor yet. Even just maintaining these prices could be difficult to achieve as the weak outlook is already weighing down the shares heavily.
What Does Star Energy Group's P/S Mean For Investors?
The latest share price surge wasn't enough to lift Star Energy Group's P/S close to the industry median. We'd say the price-to-sales ratio's power isn't primarily as a valuation instrument but rather to gauge current investor sentiment and future expectations.
As we suspected, our examination of Star Energy Group's analyst forecasts revealed that its even shakier outlook against the industry is contributing factor to why its P/S is so low. With such a gloomy outlook, investors feel the potential for an improvement in revenue isn't great enough to justify paying a premium resulting in a higher P/S ratio. Typically when industry conditions are tough, there's a real risk of company revenues sliding further, which is a concern of ours in this case. In the meantime, unless the company's prospects improve they will continue to form a barrier for the share price around these levels.
You should always think about risks. Case in point, we've spotted 2 warning signs for Star Energy Group you should be aware of.
If you're unsure about the strength of Star Energy Group's business, why not explore our interactive list of stocks with solid business fundamentals for some other companies you may have missed.
If you're looking to trade Star Energy Group, open an account with the lowest-cost platform trusted by professionals, Interactive Brokers.
With clients in over 200 countries and territories, and access to 160 markets, IBKR lets you trade stocks, options, futures, forex, bonds and funds from a single integrated account.
Enjoy no hidden fees, no account minimums, and FX conversion rates as low as 0.03%, far better than what most brokers offer.
Sponsored ContentNew: Manage All Your Stock Portfolios in One Place
We've created the ultimate portfolio companion for stock investors, and it's free.
• Connect an unlimited number of Portfolios and see your total in one currency
• Be alerted to new Warning Signs or Risks via email or mobile
• Track the Fair Value of your stocks
Have feedback on this article? Concerned about the content? Get in touch with us directly. Alternatively, email editorial-team (at) simplywallst.com.
This article by Simply Wall St is general in nature. We provide commentary based on historical data and analyst forecasts only using an unbiased methodology and our articles are not intended to be financial advice. It does not constitute a recommendation to buy or sell any stock, and does not take account of your objectives, or your financial situation. We aim to bring you long-term focused analysis driven by fundamental data. Note that our analysis may not factor in the latest price-sensitive company announcements or qualitative material. Simply Wall St has no position in any stocks mentioned.
About AIM:STAR
Star Energy Group
Operates as an oil and gas exploration, development, processing, and production company in the United Kingdom.
Fair value with imperfect balance sheet.
Similar Companies
Market Insights

Community Narratives

