Stock Analysis
- United Kingdom
- /
- Consumer Finance
- /
- LSE:SUS
Investing in S&U (LON:SUS) three years ago would have delivered you a 11% gain


Many investors define successful investing as beating the market average over the long term. But if you try your hand at stock picking, your risk returning less than the market. Unfortunately, that's been the case for longer term S&U plc (LON:SUS) shareholders, since the share price is down 4.6% in the last three years, falling well short of the market return of around 15%. It's down 8.0% in about a month.
It's worthwhile assessing if the company's economics have been moving in lockstep with these underwhelming shareholder returns, or if there is some disparity between the two. So let's do just that.
Check out our latest analysis for S&U
While markets are a powerful pricing mechanism, share prices reflect investor sentiment, not just underlying business performance. One way to examine how market sentiment has changed over time is to look at the interaction between a company's share price and its earnings per share (EPS).
During the unfortunate three years of share price decline, S&U actually saw its earnings per share (EPS) improve by 18% per year. This is quite a puzzle, and suggests there might be something temporarily buoying the share price. Alternatively, growth expectations may have been unreasonable in the past.
It is a little bizarre to see the share price down, despite a strong improvement to earnings per share. Therefore, we should look at some other metrics to try to understand why the market is disappointed.
We note that the dividend seems healthy enough, so that probably doesn't explain the share price drop. Revenue has been pretty flat over three years, so that isn't an obvious reason shareholders would sell. So it might be worth looking at how revenue growth over time, in greater detail.
The image below shows how earnings and revenue have tracked over time (if you click on the image you can see greater detail).
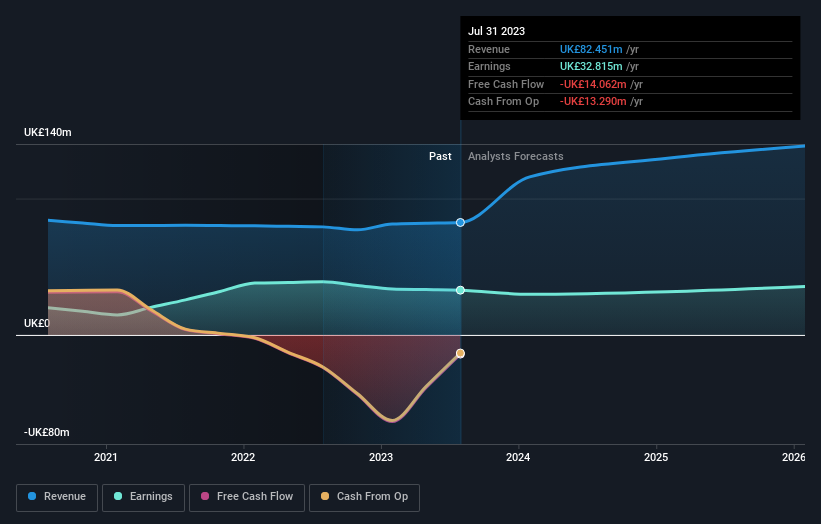
Take a more thorough look at S&U's financial health with this free report on its balance sheet.
What About Dividends?
As well as measuring the share price return, investors should also consider the total shareholder return (TSR). Whereas the share price return only reflects the change in the share price, the TSR includes the value of dividends (assuming they were reinvested) and the benefit of any discounted capital raising or spin-off. So for companies that pay a generous dividend, the TSR is often a lot higher than the share price return. As it happens, S&U's TSR for the last 3 years was 11%, which exceeds the share price return mentioned earlier. This is largely a result of its dividend payments!
A Different Perspective
We're pleased to report that S&U shareholders have received a total shareholder return of 4.6% over one year. And that does include the dividend. Having said that, the five-year TSR of 5% a year, is even better. While it is well worth considering the different impacts that market conditions can have on the share price, there are other factors that are even more important. Even so, be aware that S&U is showing 3 warning signs in our investment analysis , and 1 of those makes us a bit uncomfortable...
If you are like me, then you will not want to miss this free list of growing companies that insiders are buying.
Please note, the market returns quoted in this article reflect the market weighted average returns of stocks that currently trade on British exchanges.
Valuation is complex, but we're helping make it simple.
Find out whether S&U is potentially over or undervalued by checking out our comprehensive analysis, which includes fair value estimates, risks and warnings, dividends, insider transactions and financial health.
View the Free AnalysisHave feedback on this article? Concerned about the content? Get in touch with us directly. Alternatively, email editorial-team@simplywallst.com
Simply Wall St analyst Simply Wall St and Simply Wall St have no position in any of the companies mentioned. This article is general in nature. We provide commentary based on historical data and analyst forecasts only using an unbiased methodology and our articles are not intended to be financial advice. It does not constitute a recommendation to buy or sell any stock and does not take account of your objectives, or your financial situation. We aim to bring you long-term focused analysis driven by fundamental data. Note that our analysis may not factor in the latest price-sensitive company announcements or qualitative material.
About LSE:SUS
S&U
Provides motor, property bridging, and specialist finance services in the United Kingdom.
Average dividend payer and fair value.
