
Advertisement

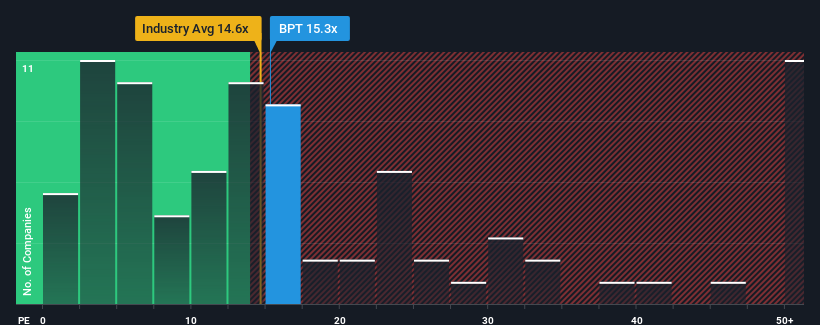
It's not a stretch to say that Bridgepoint Group plc's (LON:BPT) price-to-earnings (or "P/E") ratio of 15.3x right now seems quite "middle-of-the-road" compared to the market in the United Kingdom, where the median P/E ratio is around 14x. While this might not raise any eyebrows, if the P/E ratio is not justified investors could be missing out on a potential opportunity or ignoring looming disappointment.
Bridgepoint Group could be doing better as its earnings have been going backwards lately while most other companies have been seeing positive earnings growth. It might be that many expect the dour earnings performance to strengthen positively, which has kept the P/E from falling. You'd really hope so, otherwise you're paying a relatively elevated price for a company with this sort of growth profile.
See our latest analysis for Bridgepoint Group
What Are Growth Metrics Telling Us About The P/E?
The only time you'd be comfortable seeing a P/E like Bridgepoint Group's is when the company's growth is tracking the market closely.
If we review the last year of earnings, dishearteningly the company's profits fell to the tune of 9.8%. As a result, earnings from three years ago have also fallen 99% overall. So unfortunately, we have to acknowledge that the company has not done a great job of growing earnings over that time.
Looking ahead now, EPS is anticipated to climb by 3.0% per year during the coming three years according to the nine analysts following the company. Meanwhile, the rest of the market is forecast to expand by 12% per annum, which is noticeably more attractive.
In light of this, it's curious that Bridgepoint Group's P/E sits in line with the majority of other companies. It seems most investors are ignoring the fairly limited growth expectations and are willing to pay up for exposure to the stock. Maintaining these prices will be difficult to achieve as this level of earnings growth is likely to weigh down the shares eventually.
The Final Word
Generally, our preference is to limit the use of the price-to-earnings ratio to establishing what the market thinks about the overall health of a company.
We've established that Bridgepoint Group currently trades on a higher than expected P/E since its forecast growth is lower than the wider market. When we see a weak earnings outlook with slower than market growth, we suspect the share price is at risk of declining, sending the moderate P/E lower. This places shareholders' investments at risk and potential investors in danger of paying an unnecessary premium.
And what about other risks? Every company has them, and we've spotted 2 warning signs for Bridgepoint Group (of which 1 shouldn't be ignored!) you should know about.
Of course, you might find a fantastic investment by looking at a few good candidates. So take a peek at this free list of companies with a strong growth track record, trading on a low P/E.
Valuation is complex, but we're here to simplify it.
Discover if Bridgepoint Group might be undervalued or overvalued with our detailed analysis, featuring fair value estimates, potential risks, dividends, insider trades, and its financial condition.
Access Free AnalysisHave feedback on this article? Concerned about the content? Get in touch with us directly. Alternatively, email editorial-team (at) simplywallst.com.
This article by Simply Wall St is general in nature. We provide commentary based on historical data and analyst forecasts only using an unbiased methodology and our articles are not intended to be financial advice. It does not constitute a recommendation to buy or sell any stock, and does not take account of your objectives, or your financial situation. We aim to bring you long-term focused analysis driven by fundamental data. Note that our analysis may not factor in the latest price-sensitive company announcements or qualitative material. Simply Wall St has no position in any stocks mentioned.
About LSE:BPT
Bridgepoint Group
A private equity and private credit firm specializing in middle market, lower mid-market, small mid cap, small cap, growth capital, buyouts investments, syndicate debt, infrastructure, direct lending and credit opportunities in private credit investments.
Reasonable growth potential with mediocre balance sheet.
Similar Companies
Market Insights


Advertisement
Community Narratives
Pole position to benefit from GENIUS Act
Fair Value US$233.04|58.8% undervalued
CH
Community Contributor
IREN will transform from bitcoin miner to leader in AI infrastructure
Fair Value US$21.48|17.5% undervalued
KA
Community Contributor
Behind the Assay: XRF Scientific’s Role in Modern Mining Economics
Fair Value AU$2.10|2.4% undervalued
RO
Community Contributor