
Advertisement
- United Kingdom
- /
- Consumer Finance
- /
- LSE:ASAI
Market Cool On ASA International Group PLC's (LON:ASAI) Earnings Pushing Shares 36% Lower

ASA International Group PLC (LON:ASAI) shares have had a horrible month, losing 36% after a relatively good period beforehand. Looking at the bigger picture, even after this poor month the stock is up 27% in the last year.
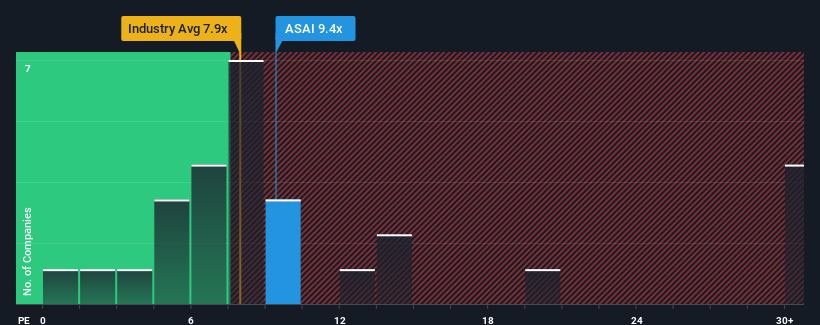
Even after such a large drop in price, given about half the companies in the United Kingdom have price-to-earnings ratios (or "P/E's") above 17x, you may still consider ASA International Group as an attractive investment with its 9.4x P/E ratio. Nonetheless, we'd need to dig a little deeper to determine if there is a rational basis for the reduced P/E.
While the market has experienced earnings growth lately, ASA International Group's earnings have gone into reverse gear, which is not great. The P/E is probably low because investors think this poor earnings performance isn't going to get any better. If this is the case, then existing shareholders will probably struggle to get excited about the future direction of the share price.
View our latest analysis for ASA International Group
What Are Growth Metrics Telling Us About The Low P/E?
ASA International Group's P/E ratio would be typical for a company that's only expected to deliver limited growth, and importantly, perform worse than the market.
Taking a look back first, the company's earnings per share growth last year wasn't something to get excited about as it posted a disappointing decline of 49%. This has erased any of its gains during the last three years, with practically no change in EPS being achieved in total. Accordingly, shareholders probably wouldn't have been overly satisfied with the unstable medium-term growth rates.
Turning to the outlook, the next three years should generate growth of 54% each year as estimated by the three analysts watching the company. That's shaping up to be materially higher than the 15% per year growth forecast for the broader market.
In light of this, it's peculiar that ASA International Group's P/E sits below the majority of other companies. Apparently some shareholders are doubtful of the forecasts and have been accepting significantly lower selling prices.
The Bottom Line On ASA International Group's P/E
The softening of ASA International Group's shares means its P/E is now sitting at a pretty low level. Generally, our preference is to limit the use of the price-to-earnings ratio to establishing what the market thinks about the overall health of a company.
Our examination of ASA International Group's analyst forecasts revealed that its superior earnings outlook isn't contributing to its P/E anywhere near as much as we would have predicted. There could be some major unobserved threats to earnings preventing the P/E ratio from matching the positive outlook. It appears many are indeed anticipating earnings instability, because these conditions should normally provide a boost to the share price.
You need to take note of risks, for example - ASA International Group has 4 warning signs (and 1 which is concerning) we think you should know about.
If you're unsure about the strength of ASA International Group's business, why not explore our interactive list of stocks with solid business fundamentals for some other companies you may have missed.
New: Manage All Your Stock Portfolios in One Place
We've created the ultimate portfolio companion for stock investors, and it's free.
• Connect an unlimited number of Portfolios and see your total in one currency
• Be alerted to new Warning Signs or Risks via email or mobile
• Track the Fair Value of your stocks
Have feedback on this article? Concerned about the content? Get in touch with us directly. Alternatively, email editorial-team (at) simplywallst.com.
This article by Simply Wall St is general in nature. We provide commentary based on historical data and analyst forecasts only using an unbiased methodology and our articles are not intended to be financial advice. It does not constitute a recommendation to buy or sell any stock, and does not take account of your objectives, or your financial situation. We aim to bring you long-term focused analysis driven by fundamental data. Note that our analysis may not factor in the latest price-sensitive company announcements or qualitative material. Simply Wall St has no position in any stocks mentioned.
About LSE:ASAI
ASA International Group
Operates as a microfinance institution in Asia and Africa.
Undervalued with high growth potential.
Market Insights

Advertisement
Community Narratives
Groundbreaking therapies that could change the treatment landscape for PTSD, fibromyalgia, MS & Alzheimer’s
Fair Value US$6.20|86.8% undervalued
CM
Community Contributor
DigitalOcean Will Grow 14% by Embracing AI with Paperspace Acquisition
Fair Value US$50.00|42.8% undervalued
NE
Community Contributor
Viant Technology: A Rising AdTech Challenger in the AI-Powered CTV Market
Fair Value US$38.61|61.4% undervalued
BL
Community Contributor
Volvo will Accelerate Forward into Electric and Autonomous Leadership in Five Years
Fair Value SEK 438.80|40.8% undervalued
UN
Community Contributor