- United Kingdom
- /
- Capital Markets
- /
- AIM:AGFX
Argentex Group PLC (LON:AGFX) Soars 26% But It's A Story Of Risk Vs Reward

Argentex Group PLC (LON:AGFX) shareholders have had their patience rewarded with a 26% share price jump in the last month. Not all shareholders will be feeling jubilant, since the share price is still down a very disappointing 13% in the last twelve months.
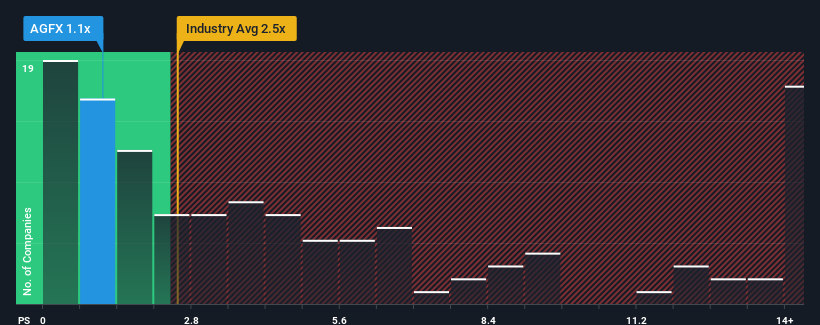
Although its price has surged higher, Argentex Group may still be sending bullish signals at the moment with its price-to-sales (or "P/S") ratio of 1.1x, since almost half of all companies in the Capital Markets industry in the United Kingdom have P/S ratios greater than 2.5x and even P/S higher than 8x are not unusual. Nonetheless, we'd need to dig a little deeper to determine if there is a rational basis for the reduced P/S.
See our latest analysis for Argentex Group
What Does Argentex Group's P/S Mean For Shareholders?
Argentex Group could be doing better as it's been growing revenue less than most other companies lately. The P/S ratio is probably low because investors think this lacklustre revenue performance isn't going to get any better. If this is the case, then existing shareholders will probably struggle to get excited about the future direction of the share price.
Keen to find out how analysts think Argentex Group's future stacks up against the industry? In that case, our free report is a great place to start .Is There Any Revenue Growth Forecasted For Argentex Group?
Argentex Group's P/S ratio would be typical for a company that's only expected to deliver limited growth, and importantly, perform worse than the industry.
Taking a look back first, we see that there was hardly any revenue growth to speak of for the company over the past year. Still, the latest three year period has seen an excellent 51% overall rise in revenue, in spite of its uninspiring short-term performance. So while the company has done a solid job in the past, it's somewhat concerning to see revenue growth decline as much as it has.
Turning to the outlook, the next three years should generate growth of 9.0% per annum as estimated by the sole analyst watching the company. Meanwhile, the rest of the industry is forecast to only expand by 3.7% per year, which is noticeably less attractive.
With this in consideration, we find it intriguing that Argentex Group's P/S sits behind most of its industry peers. Apparently some shareholders are doubtful of the forecasts and have been accepting significantly lower selling prices.
What Does Argentex Group's P/S Mean For Investors?
The latest share price surge wasn't enough to lift Argentex Group's P/S close to the industry median. Typically, we'd caution against reading too much into price-to-sales ratios when settling on investment decisions, though it can reveal plenty about what other market participants think about the company.
To us, it seems Argentex Group currently trades on a significantly depressed P/S given its forecasted revenue growth is higher than the rest of its industry. There could be some major risk factors that are placing downward pressure on the P/S ratio. While the possibility of the share price plunging seems unlikely due to the high growth forecasted for the company, the market does appear to have some hesitation.
It is also worth noting that we have found 3 warning signs for Argentex Group (2 make us uncomfortable!) that you need to take into consideration.
Of course, profitable companies with a history of great earnings growth are generally safer bets. So you may wish to see this free collection of other companies that have reasonable P/E ratios and have grown earnings strongly.
Mobile Infrastructure for Defense and Disaster
The next wave in robotics isn't humanoid. Its fully autonomous towers delivering 5G, ISR, and radar in under 30 minutes, anywhere.
Get the investor briefing before the next round of contracts
Sponsored On Behalf of CiTechNew: Manage All Your Stock Portfolios in One Place
We've created the ultimate portfolio companion for stock investors, and it's free.
• Connect an unlimited number of Portfolios and see your total in one currency
• Be alerted to new Warning Signs or Risks via email or mobile
• Track the Fair Value of your stocks
Have feedback on this article? Concerned about the content? Get in touch with us directly. Alternatively, email editorial-team (at) simplywallst.com.
This article by Simply Wall St is general in nature. We provide commentary based on historical data and analyst forecasts only using an unbiased methodology and our articles are not intended to be financial advice. It does not constitute a recommendation to buy or sell any stock, and does not take account of your objectives, or your financial situation. We aim to bring you long-term focused analysis driven by fundamental data. Note that our analysis may not factor in the latest price-sensitive company announcements or qualitative material. Simply Wall St has no position in any stocks mentioned.
About AIM:AGFX
Argentex Group
Provides currency risk management, payment, and alternative banking solutions in the United Kingdom, the Netherlands, the United Arab Emirates, and Australia.
Flawless balance sheet and undervalued.
Similar Companies
Market Insights

Weekly Picks

Early mover in a fast growing industry. Likely to experience share price volatility as they scale


A case for CA$31.80 (undiluted), aka 8,616% upside from CA$0.37 (an 86 bagger!).


Moderation and Stabilisation: HOLD: Fair Price based on a 4-year Cycle is $12.08
Recently Updated Narratives

Airbnb Stock: Platform Growth in a World of Saturation and Scrutiny

Clarivate Stock: When Data Becomes the Backbone of Innovation and Law

Adobe Stock: AI-Fueled ARR Growth Pushes Guidance Higher, But Cost Pressures Loom
Popular Narratives


Crazy Undervalued 42 Baggers Silver Play (Active & Running Mine)


NVDA: Expanding AI Demand Will Drive Major Data Center Investments Through 2026


MicroVision will explode future revenue by 380.37% with a vision towards success
Trending Discussion
