- United Kingdom
- /
- Hospitality
- /
- LSE:CPG
Investors Could Be Concerned With Compass Group's (LON:CPG) Returns On Capital


What are the early trends we should look for to identify a stock that could multiply in value over the long term? One common approach is to try and find a company with returns on capital employed (ROCE) that are increasing, in conjunction with a growing amount of capital employed. If you see this, it typically means it's a company with a great business model and plenty of profitable reinvestment opportunities. Although, when we looked at Compass Group (LON:CPG), it didn't seem to tick all of these boxes.
Return On Capital Employed (ROCE): What is it?
For those that aren't sure what ROCE is, it measures the amount of pre-tax profits a company can generate from the capital employed in its business. To calculate this metric for Compass Group, this is the formula:
Return on Capital Employed = Earnings Before Interest and Tax (EBIT) ÷ (Total Assets - Current Liabilities)
0.0012 = UK£11m ÷ (UK£14b - UK£4.6b) (Based on the trailing twelve months to March 2021).
So, Compass Group has an ROCE of 0.1%. In absolute terms, that's a low return and it also under-performs the Hospitality industry average of 8.9%.
View our latest analysis for Compass Group
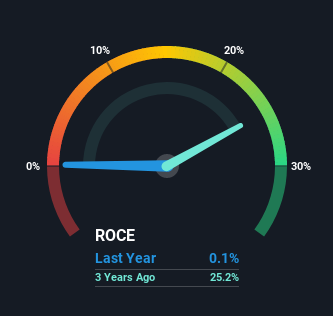
Above you can see how the current ROCE for Compass Group compares to its prior returns on capital, but there's only so much you can tell from the past. If you're interested, you can view the analysts predictions in our free report on analyst forecasts for the company.
So How Is Compass Group's ROCE Trending?
We weren't thrilled with the trend because Compass Group's ROCE has reduced by 100% over the last five years, while the business employed 75% more capital. Usually this isn't ideal, but given Compass Group conducted a capital raising before their most recent earnings announcement, that would've likely contributed, at least partially, to the increased capital employed figure. The funds raised likely haven't been put to work yet so it's worth watching what happens in the future with Compass Group's earnings and if they change as a result from the capital raise.
On a side note, Compass Group has done well to pay down its current liabilities to 33% of total assets. That could partly explain why the ROCE has dropped. Effectively this means their suppliers or short-term creditors are funding less of the business, which reduces some elements of risk. Since the business is basically funding more of its operations with it's own money, you could argue this has made the business less efficient at generating ROCE.
The Bottom Line
In summary, we're somewhat concerned by Compass Group's diminishing returns on increasing amounts of capital. In spite of that, the stock has delivered a 13% return to shareholders who held over the last five years. Regardless, we don't like the trends as they are and if they persist, we think you might find better investments elsewhere.
Compass Group does have some risks though, and we've spotted 1 warning sign for Compass Group that you might be interested in.
While Compass Group may not currently earn the highest returns, we've compiled a list of companies that currently earn more than 25% return on equity. Check out this free list here.
If you're looking to trade Compass Group, open an account with the lowest-cost platform trusted by professionals, Interactive Brokers.
With clients in over 200 countries and territories, and access to 160 markets, IBKR lets you trade stocks, options, futures, forex, bonds and funds from a single integrated account.
Enjoy no hidden fees, no account minimums, and FX conversion rates as low as 0.03%, far better than what most brokers offer.
Sponsored ContentNew: AI Stock Screener & Alerts
Our new AI Stock Screener scans the market every day to uncover opportunities.
• Dividend Powerhouses (3%+ Yield)
• Undervalued Small Caps with Insider Buying
• High growth Tech and AI Companies
Or build your own from over 50 metrics.
This article by Simply Wall St is general in nature. We provide commentary based on historical data and analyst forecasts only using an unbiased methodology and our articles are not intended to be financial advice. It does not constitute a recommendation to buy or sell any stock, and does not take account of your objectives, or your financial situation. We aim to bring you long-term focused analysis driven by fundamental data. Note that our analysis may not factor in the latest price-sensitive company announcements or qualitative material. Simply Wall St has no position in any stocks mentioned.
Have feedback on this article? Concerned about the content? Get in touch with us directly. Alternatively, email editorial-team (at) simplywallst.com.
About LSE:CPG
Compass Group
Provides food and support services in North America, Europe, Asia Pacific, and internationally.
Reasonable growth potential with adequate balance sheet.
Similar Companies
Market Insights

Community Narratives

