
Advertisement

The external fund manager backed by Berkshire Hathaway's Charlie Munger, Li Lu, makes no bones about it when he says 'The biggest investment risk is not the volatility of prices, but whether you will suffer a permanent loss of capital.' It's only natural to consider a company's balance sheet when you examine how risky it is, since debt is often involved when a business collapses. As with many other companies J Sainsbury plc (LON:SBRY) makes use of debt. But should shareholders be worried about its use of debt?
What Risk Does Debt Bring?
Debt assists a business until the business has trouble paying it off, either with new capital or with free cash flow. Ultimately, if the company can't fulfill its legal obligations to repay debt, shareholders could walk away with nothing. While that is not too common, we often do see indebted companies permanently diluting shareholders because lenders force them to raise capital at a distressed price. Having said that, the most common situation is where a company manages its debt reasonably well - and to its own advantage. The first thing to do when considering how much debt a business uses is to look at its cash and debt together.
View our latest analysis for J Sainsbury
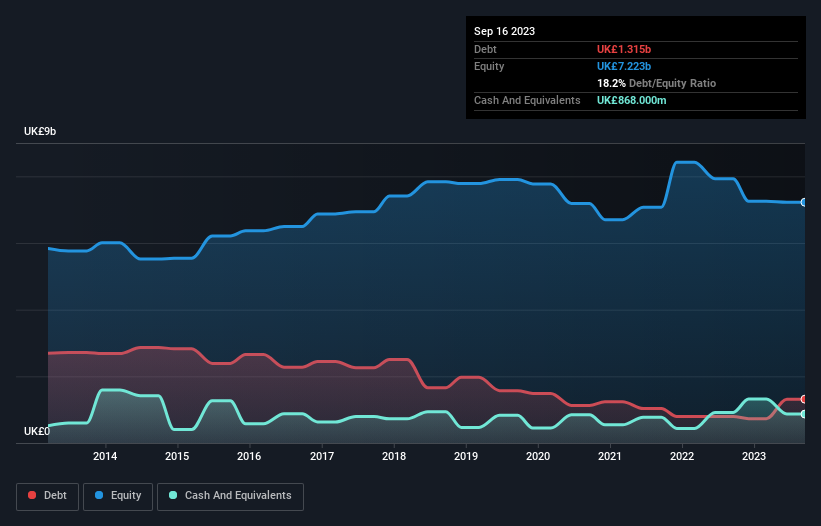
What Is J Sainsbury's Net Debt?
As you can see below, at the end of September 2023, J Sainsbury had UK£1.32b of debt, up from UK£795.0m a year ago. Click the image for more detail. On the flip side, it has UK£868.0m in cash leading to net debt of about UK£447.0m.
How Healthy Is J Sainsbury's Balance Sheet?
The latest balance sheet data shows that J Sainsbury had liabilities of UK£11.6b due within a year, and liabilities of UK£7.35b falling due after that. Offsetting these obligations, it had cash of UK£868.0m as well as receivables valued at UK£669.0m due within 12 months. So its liabilities total UK£17.4b more than the combination of its cash and short-term receivables.
This deficit casts a shadow over the UK£6.43b company, like a colossus towering over mere mortals. So we definitely think shareholders need to watch this one closely. After all, J Sainsbury would likely require a major re-capitalisation if it had to pay its creditors today.
In order to size up a company's debt relative to its earnings, we calculate its net debt divided by its earnings before interest, tax, depreciation, and amortization (EBITDA) and its earnings before interest and tax (EBIT) divided by its interest expense (its interest cover). The advantage of this approach is that we take into account both the absolute quantum of debt (with net debt to EBITDA) and the actual interest expenses associated with that debt (with its interest cover ratio).
Looking at its net debt to EBITDA of 0.28 and interest cover of 3.5 times, it seems to us that J Sainsbury is probably using debt in a pretty reasonable way. But the interest payments are certainly sufficient to have us thinking about how affordable its debt is. Notably J Sainsbury's EBIT was pretty flat over the last year. We would prefer to see some earnings growth, because that always helps diminish debt. When analysing debt levels, the balance sheet is the obvious place to start. But ultimately the future profitability of the business will decide if J Sainsbury can strengthen its balance sheet over time. So if you're focused on the future you can check out this free report showing analyst profit forecasts.
But our final consideration is also important, because a company cannot pay debt with paper profits; it needs cold hard cash. So the logical step is to look at the proportion of that EBIT that is matched by actual free cash flow. Over the last three years, J Sainsbury recorded free cash flow worth a fulsome 87% of its EBIT, which is stronger than we'd usually expect. That positions it well to pay down debt if desirable to do so.
Our View
While J Sainsbury's level of total liabilities has us nervous. For example, its conversion of EBIT to free cash flow and net debt to EBITDA give us some confidence in its ability to manage its debt. Taking the abovementioned factors together we do think J Sainsbury's debt poses some risks to the business. So while that leverage does boost returns on equity, we wouldn't really want to see it increase from here. The balance sheet is clearly the area to focus on when you are analysing debt. However, not all investment risk resides within the balance sheet - far from it. We've identified 3 warning signs with J Sainsbury (at least 1 which is a bit concerning) , and understanding them should be part of your investment process.
At the end of the day, it's often better to focus on companies that are free from net debt. You can access our special list of such companies (all with a track record of profit growth). It's free.
New: Manage All Your Stock Portfolios in One Place
We've created the ultimate portfolio companion for stock investors, and it's free.
• Connect an unlimited number of Portfolios and see your total in one currency
• Be alerted to new Warning Signs or Risks via email or mobile
• Track the Fair Value of your stocks
Have feedback on this article? Concerned about the content? Get in touch with us directly. Alternatively, email editorial-team (at) simplywallst.com.
This article by Simply Wall St is general in nature. We provide commentary based on historical data and analyst forecasts only using an unbiased methodology and our articles are not intended to be financial advice. It does not constitute a recommendation to buy or sell any stock, and does not take account of your objectives, or your financial situation. We aim to bring you long-term focused analysis driven by fundamental data. Note that our analysis may not factor in the latest price-sensitive company announcements or qualitative material. Simply Wall St has no position in any stocks mentioned.
About LSE:SBRY
J Sainsbury
Engages in the food, general merchandise and clothing retailing, and financial services activities in the United Kingdom and the Republic of Ireland.
Excellent balance sheet with proven track record.
Similar Companies
Market Insights


Advertisement
Community Narratives
Nike's Direct-to-Consumer Focus Will Drive Future Growth
Fair Value US$87.90|18.2% undervalued
UN
Community Contributor
Novo Nordisk will dominate GLP-1 market with Ozempic and Wegovy growth
Fair Value US$89.59|12.1% undervalued
BE
Community Contributor
Rheinmetall could get 20-25% of EU-NATO 3%-GDP defence spending
Fair Value €7.57k|82.4% undervalued
NO
Community Contributor