- United Kingdom
- /
- Consumer Durables
- /
- LSE:CRST
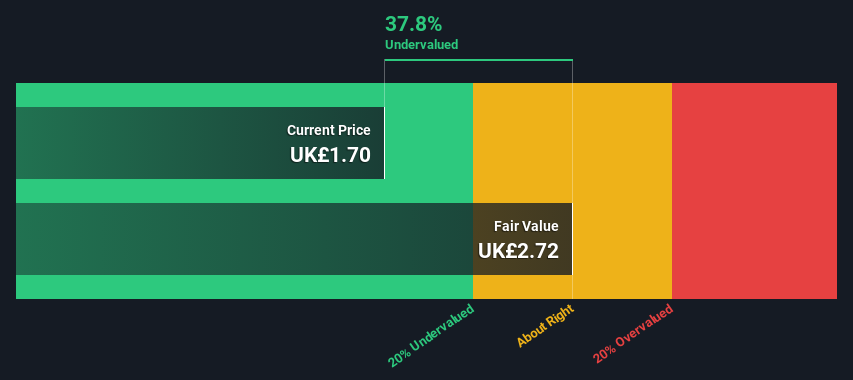
An Intrinsic Calculation For Crest Nicholson Holdings plc (LON:CRST) Suggests It's 38% Undervalued

Key Insights
- Crest Nicholson Holdings' estimated fair value is UK£2.72 based on 2 Stage Free Cash Flow to Equity
- Crest Nicholson Holdings is estimated to be 38% undervalued based on current share price of UK£1.70
- Our fair value estimate is 23% higher than Crest Nicholson Holdings' analyst price target of UK£2.21
Does the September share price for Crest Nicholson Holdings plc (LON:CRST) reflect what it's really worth? Today, we will estimate the stock's intrinsic value by taking the expected future cash flows and discounting them to today's value. Our analysis will employ the Discounted Cash Flow (DCF) model. Before you think you won't be able to understand it, just read on! It's actually much less complex than you'd imagine.
Remember though, that there are many ways to estimate a company's value, and a DCF is just one method. Anyone interested in learning a bit more about intrinsic value should have a read of the Simply Wall St analysis model.
View our latest analysis for Crest Nicholson Holdings
The Calculation
We're using the 2-stage growth model, which simply means we take in account two stages of company's growth. In the initial period the company may have a higher growth rate and the second stage is usually assumed to have a stable growth rate. In the first stage we need to estimate the cash flows to the business over the next ten years. Where possible we use analyst estimates, but when these aren't available we extrapolate the previous free cash flow (FCF) from the last estimate or reported value. We assume companies with shrinking free cash flow will slow their rate of shrinkage, and that companies with growing free cash flow will see their growth rate slow, over this period. We do this to reflect that growth tends to slow more in the early years than it does in later years.
A DCF is all about the idea that a dollar in the future is less valuable than a dollar today, and so the sum of these future cash flows is then discounted to today's value:
10-year free cash flow (FCF) forecast
| 2024 | 2025 | 2026 | 2027 | 2028 | 2029 | 2030 | 2031 | 2032 | 2033 | |
| Levered FCF (£, Millions) | UK£33.8m | UK£40.8m | UK£45.9m | UK£50.2m | UK£53.6m | UK£56.4m | UK£58.7m | UK£60.6m | UK£62.3m | UK£63.7m |
| Growth Rate Estimate Source | Analyst x4 | Analyst x3 | Est @ 12.57% | Est @ 9.21% | Est @ 6.86% | Est @ 5.22% | Est @ 4.07% | Est @ 3.26% | Est @ 2.70% | Est @ 2.30% |
| Present Value (£, Millions) Discounted @ 8.8% | UK£31.0 | UK£34.5 | UK£35.6 | UK£35.8 | UK£35.1 | UK£34.0 | UK£32.5 | UK£30.8 | UK£29.1 | UK£27.3 |
("Est" = FCF growth rate estimated by Simply Wall St)
Present Value of 10-year Cash Flow (PVCF) = UK£326m
The second stage is also known as Terminal Value, this is the business's cash flow after the first stage. For a number of reasons a very conservative growth rate is used that cannot exceed that of a country's GDP growth. In this case we have used the 5-year average of the 10-year government bond yield (1.4%) to estimate future growth. In the same way as with the 10-year 'growth' period, we discount future cash flows to today's value, using a cost of equity of 8.8%.
Terminal Value (TV)= FCF2033 × (1 + g) ÷ (r – g) = UK£64m× (1 + 1.4%) ÷ (8.8%– 1.4%) = UK£867m
Present Value of Terminal Value (PVTV)= TV / (1 + r)10= UK£867m÷ ( 1 + 8.8%)10= UK£372m
The total value is the sum of cash flows for the next ten years plus the discounted terminal value, which results in the Total Equity Value, which in this case is UK£698m. To get the intrinsic value per share, we divide this by the total number of shares outstanding. Compared to the current share price of UK£1.7, the company appears quite undervalued at a 38% discount to where the stock price trades currently. Remember though, that this is just an approximate valuation, and like any complex formula - garbage in, garbage out.
The Assumptions
We would point out that the most important inputs to a discounted cash flow are the discount rate and of course the actual cash flows. If you don't agree with these result, have a go at the calculation yourself and play with the assumptions. The DCF also does not consider the possible cyclicality of an industry, or a company's future capital requirements, so it does not give a full picture of a company's potential performance. Given that we are looking at Crest Nicholson Holdings as potential shareholders, the cost of equity is used as the discount rate, rather than the cost of capital (or weighted average cost of capital, WACC) which accounts for debt. In this calculation we've used 8.8%, which is based on a levered beta of 1.260. Beta is a measure of a stock's volatility, compared to the market as a whole. We get our beta from the industry average beta of globally comparable companies, with an imposed limit between 0.8 and 2.0, which is a reasonable range for a stable business.
SWOT Analysis for Crest Nicholson Holdings
- Debt is well covered by earnings.
- Dividend is in the top 25% of dividend payers in the market.
- No major weaknesses identified for CRST.
- Good value based on P/E ratio and estimated fair value.
- Debt is not well covered by operating cash flow.
- Paying a dividend but company has no free cash flows.
- Annual earnings are forecast to decline for the next 3 years.
Moving On:
Valuation is only one side of the coin in terms of building your investment thesis, and it ideally won't be the sole piece of analysis you scrutinize for a company. The DCF model is not a perfect stock valuation tool. Preferably you'd apply different cases and assumptions and see how they would impact the company's valuation. For instance, if the terminal value growth rate is adjusted slightly, it can dramatically alter the overall result. What is the reason for the share price sitting below the intrinsic value? For Crest Nicholson Holdings, there are three further elements you should consider:
- Risks: For example, we've discovered 3 warning signs for Crest Nicholson Holdings (2 are a bit unpleasant!) that you should be aware of before investing here.
- Future Earnings: How does CRST's growth rate compare to its peers and the wider market? Dig deeper into the analyst consensus number for the upcoming years by interacting with our free analyst growth expectation chart.
- Other Solid Businesses: Low debt, high returns on equity and good past performance are fundamental to a strong business. Why not explore our interactive list of stocks with solid business fundamentals to see if there are other companies you may not have considered!
PS. The Simply Wall St app conducts a discounted cash flow valuation for every stock on the LSE every day. If you want to find the calculation for other stocks just search here.
Mobile Infrastructure for Defense and Disaster
The next wave in robotics isn't humanoid. Its fully autonomous towers delivering 5G, ISR, and radar in under 30 minutes, anywhere.
Get the investor briefing before the next round of contracts
Sponsored On Behalf of CiTechNew: AI Stock Screener & Alerts
Our new AI Stock Screener scans the market every day to uncover opportunities.
• Dividend Powerhouses (3%+ Yield)
• Undervalued Small Caps with Insider Buying
• High growth Tech and AI Companies
Or build your own from over 50 metrics.
Have feedback on this article? Concerned about the content? Get in touch with us directly. Alternatively, email editorial-team (at) simplywallst.com.
This article by Simply Wall St is general in nature. We provide commentary based on historical data and analyst forecasts only using an unbiased methodology and our articles are not intended to be financial advice. It does not constitute a recommendation to buy or sell any stock, and does not take account of your objectives, or your financial situation. We aim to bring you long-term focused analysis driven by fundamental data. Note that our analysis may not factor in the latest price-sensitive company announcements or qualitative material. Simply Wall St has no position in any stocks mentioned.
About LSE:CRST
Crest Nicholson Holdings
Engages in building residential homes in the United Kingdom.
Reasonable growth potential with adequate balance sheet.
Similar Companies
Market Insights

Weekly Picks

Early mover in a fast growing industry. Likely to experience share price volatility as they scale


A case for CA$31.80 (undiluted), aka 8,616% upside from CA$0.37 (an 86 bagger!).


Moderation and Stabilisation: HOLD: Fair Price based on a 4-year Cycle is $12.08
Recently Updated Narratives


Positioned to Win as the Streaming Wars Settle

Meta’s Bold Bet on AI Pays Off

ADP Stock: Solid Fundamentals, But AI Investments Test Its Margin Resilience
Popular Narratives


Crazy Undervalued 42 Baggers Silver Play (Active & Running Mine)


NVDA: Expanding AI Demand Will Drive Major Data Center Investments Through 2026

The AI Infrastructure Giant Grows Into Its Valuation
Trending Discussion

